OpsBeacon User Guide
Everything your store team needs to run floor TVs, leadership dashboards, Employee Scheduling, Order Request, Ops Intelligence, CRM outreach, the companion mobile app, and marketing tools.
New here? Start with Getting started, Account security & MFA, and Roles & access.
Getting started
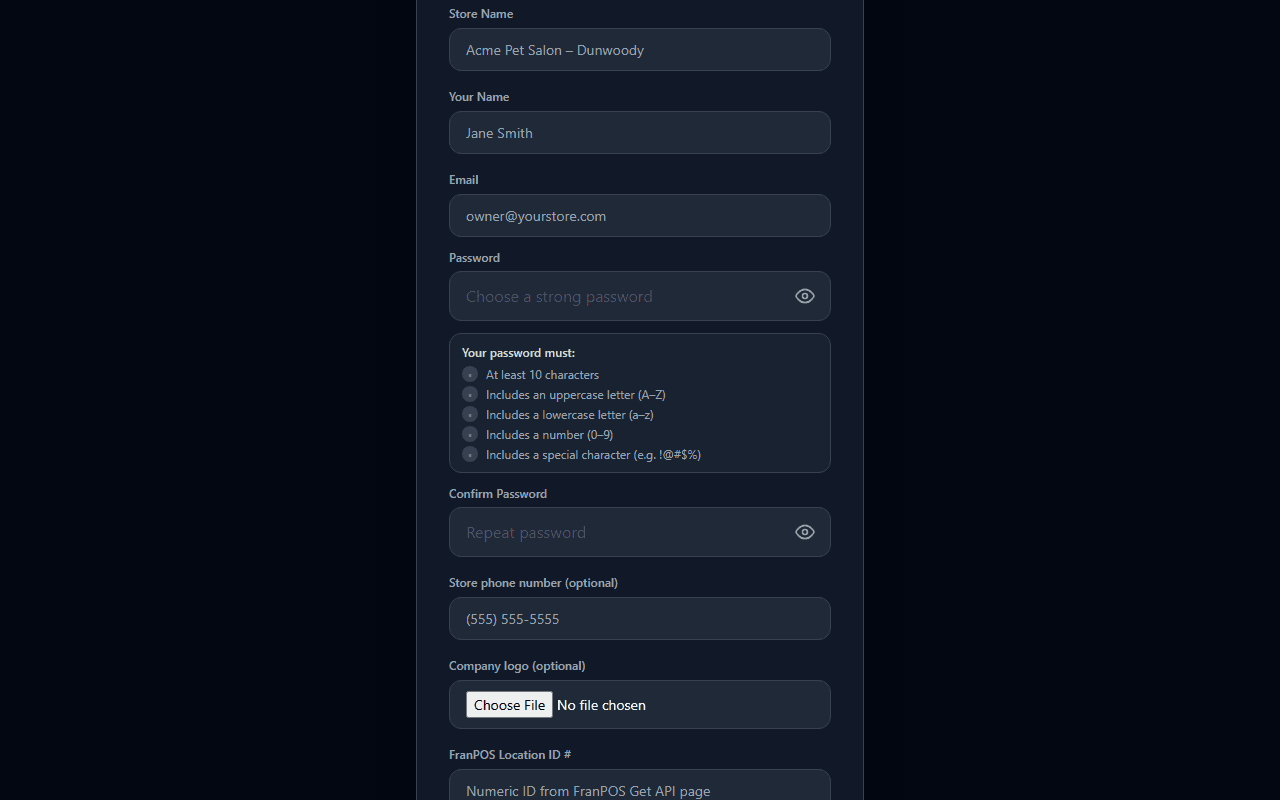
Setting up your store takes just a few minutes.
Forgot your password?
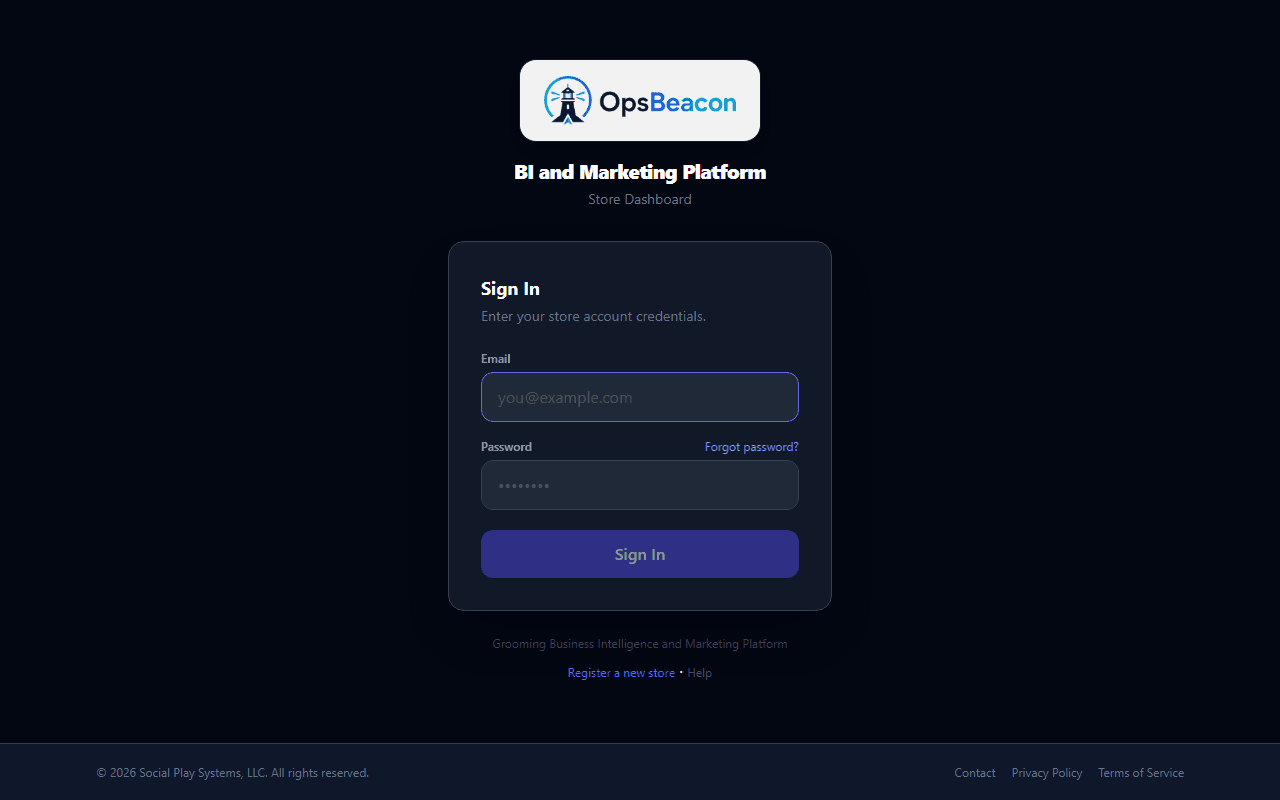
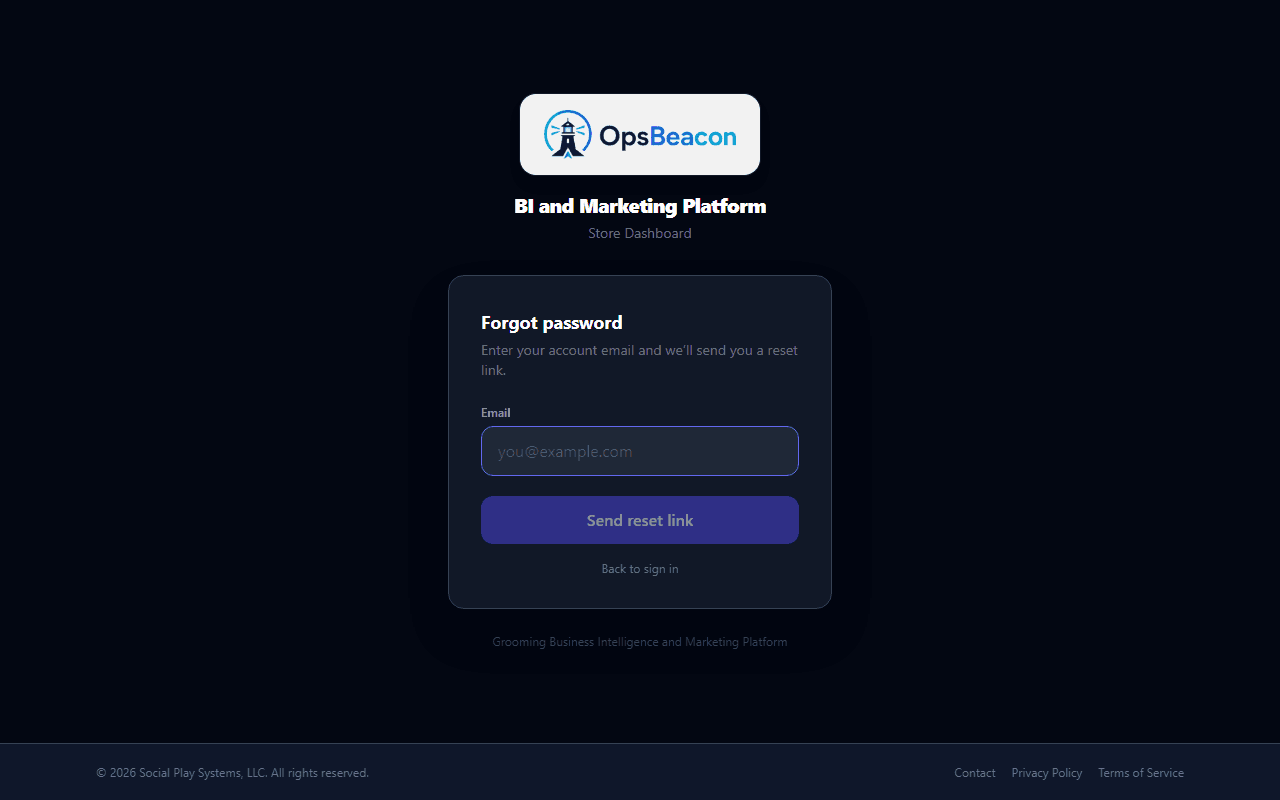
On the sign-in page, click Forgot password? and enter your account email. You'll receive a reset link (valid for about one hour). Open the link, choose a new password, then return to /login to sign in.
The first person to register a store becomes the owner. Owners can invite team members, manage billing, and update store settings. You can also assign a manager role for day-to-day admin without full billing control. Everyone else joins as staff.
Account security & MFA
SMS multi-factor authentication and Terms acceptance protect every store account.
After your first successful sign-in (and whenever MFA is required), OpsBeacon asks you to enroll a phone number before opening Admin or dashboards.
Set up MFA
SMS multi-factor authentication setup
public/help/account-mfa.png
Add this PNG to the help folder, then remove pending from the guide.
Account security settings
public/help/account-security.png
Add this PNG to the help folder, then remove pending from the guide.
Accept Terms of Service
Before using the product you must accept the Terms of Service and Privacy Policy at /account/accept-terms. This is a one-time gate per account (re-prompted if terms are updated).
Accept Terms of Service screen
public/help/accept-terms.png
Add this PNG to the help folder, then remove pending from the guide.
Roles & access
Three store roles control what each person can see and change.
Owner
- Full Admin access
- Billing & subscription
- FranPOS credentials
- Team invites & roles
- Ops Intelligence & Pay Sheets
- Executive Dashboard preset
Manager
- Most Admin cards (read/write)
- Store & Billing (view only)
- Ops Intelligence & Pay Sheets
- Custom slides & KPI targets
- Marketing tools (ALFIE hub, CRM, campaigns)
- Executive Dashboard (personalized)
Staff
- My Home (/me) - pay, rankings, reviews
- Order Request (groomer / bather / retail when enabled)
- My Grooming Dashboard (linked groomers only)
- TV Dashboard & team slideshow (non-groomers)
- Personal slide preferences (gear menu)
- No Admin billing or team access
- No Ops Intelligence
Where each role lands after sign-in
- Owners & managers → Executive Dashboard
- Staff (linked groomers) → My Home with a My Dashboard button to My Grooming Dashboard
- Staff (other roles) → My Home or the store TV slideshow at /team
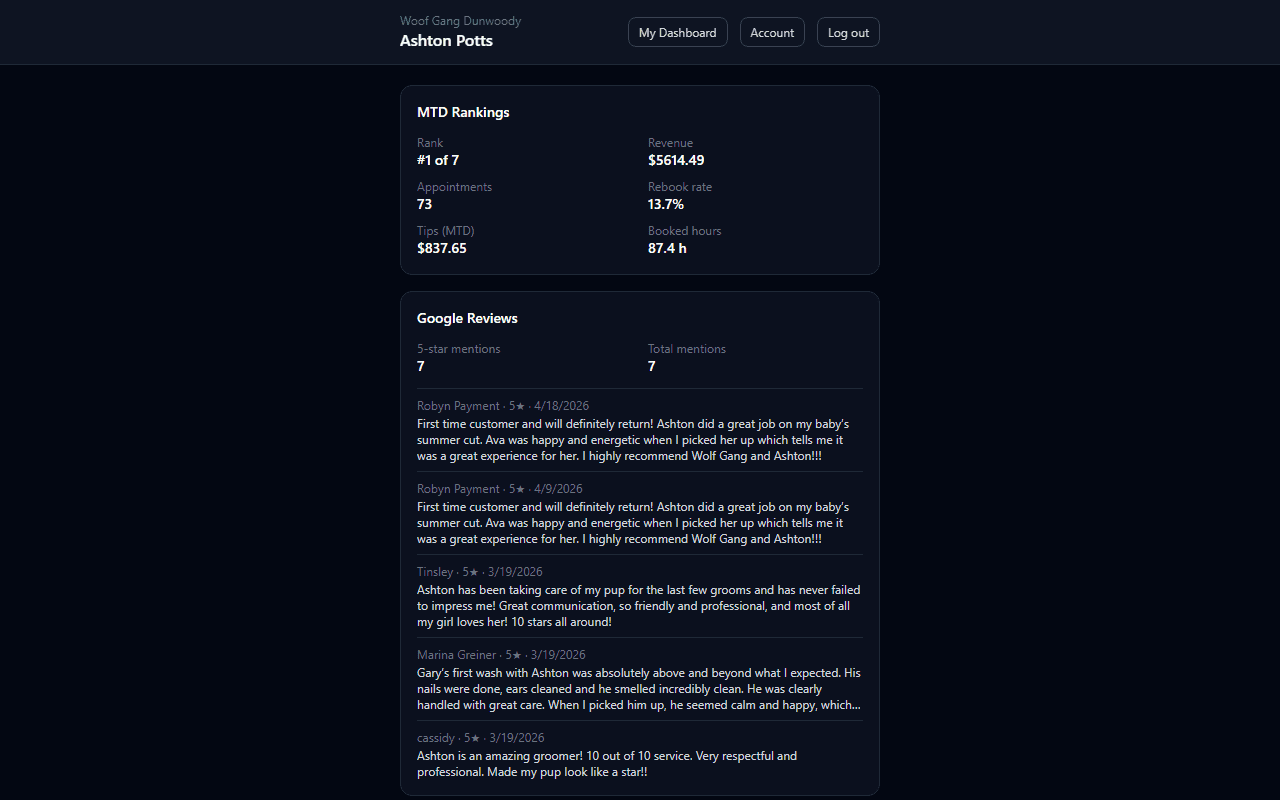
Linked groomers who open /team are redirected to My Grooming Dashboard - they never receive the full store TV dashboard.
Owners assign roles from Admin → Team Access. Only owners can change billing or invite new users.
TV Dashboard
A full-screen rotating slideshow designed to run on a TV in your store.
After signing in, your home page becomes the TV Dashboard. It cycles through slides showing your store's key data at a glance. Built-in slides include:
- Goals - daily and monthly targets vs. actuals
- Performance (KPIs) - revenue, average ticket, grooming counts, and more
- Pulse - traffic-light health orbs for revenue, appointments, and rebook rate
- 30-day Trends - revenue chart and day-of-week sparklines
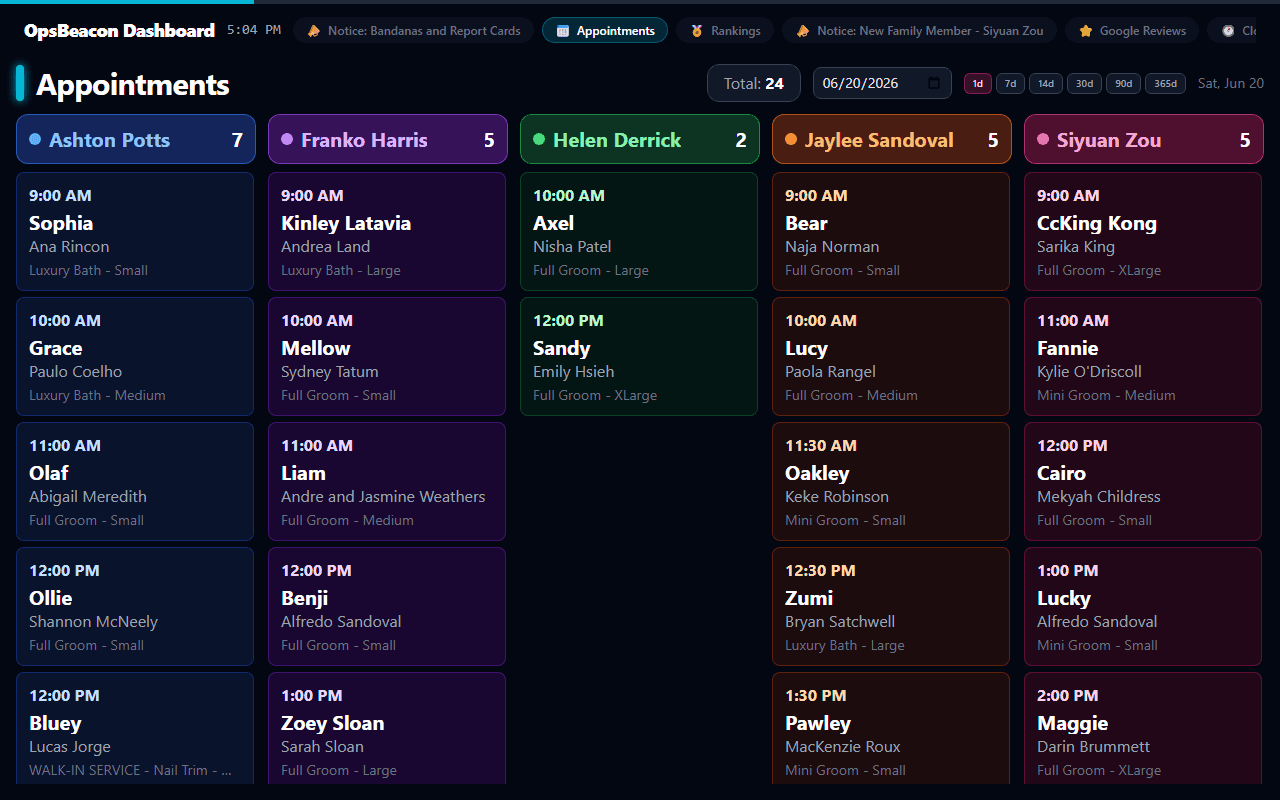
- Appointments - today's schedule pulled from FranPOS, including an Accept badge when online bookings are waiting for approval
- Rankings - groomer performance leaderboard
- Google Reviews - Google 5-star review counts and team shout-outs
- Weather - current local conditions and a 7-day forecast based on your store's city/state
- Clock - full-screen digital clock with day and date, optional in the rotation
- Custom slides - any slides you build in the Custom Slide Builder will rotate in alongside the built-in ones
Per-slide zoom
Some slides look best at a different zoom level on your TV. Hover over a slide and the + / − zoom controls appear in the corner. Adjusting zoom only affects the current slide, and the setting is saved on that device - the next time you open the TV Dashboard on the same device, each slide remembers its own zoom level.
Customizing the slideshow
Click the gear icon in the top-right corner of the TV Dashboard to open slideshow settings. From there you can:
- Turn individual slides on or off for your personal view
- Reorder slides
Staff use the gear menu to personalize their own view. Owners control the master list of slides and the rotation speed from Admin → Dashboard / TV Slides (see below).
Pending online bookings (Accept)
When FranPOS online bookings sit in Requires Approval, the Appointments slide shows a red Accept badge with a count. The badge covers today and future dates so you do not miss bookings scheduled ahead. Tap it to open the pending list on Executive or Staff TV. Completing the accept/reject workflow still happens in FranPOS - the badge is your store-floor reminder that approvals are waiting.
Appointments slide Accept badge for pending online bookings
public/help/appointments-pending.png
Add this PNG to the help folder, then remove pending from the guide.
Executive Dashboard
A leadership-focused slideshow for owners and managers - manual navigation, no auto-rotate.
Open it from the Admin quick links or go to /dashboard/executive. It uses the same slide types as the TV Dashboard but is tuned for desk or back-office screens where you want to click through slides at your own pace.
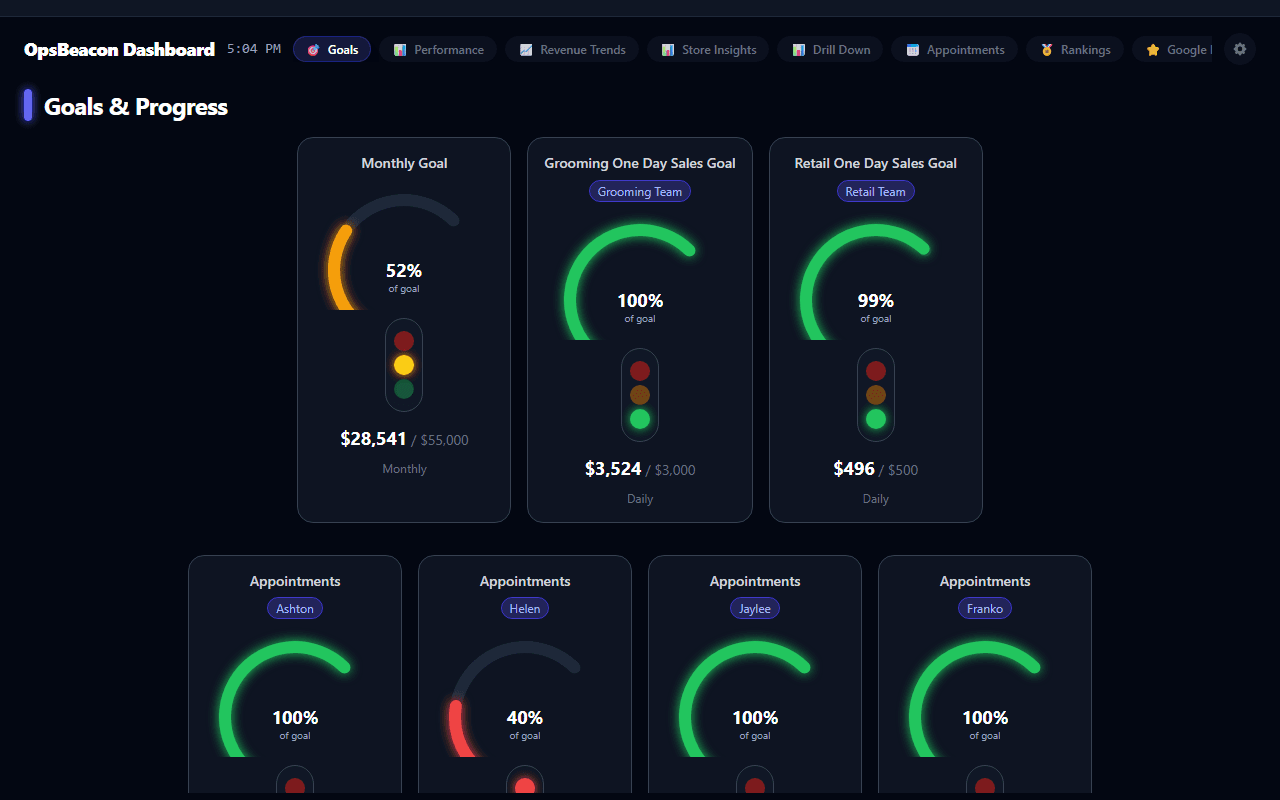
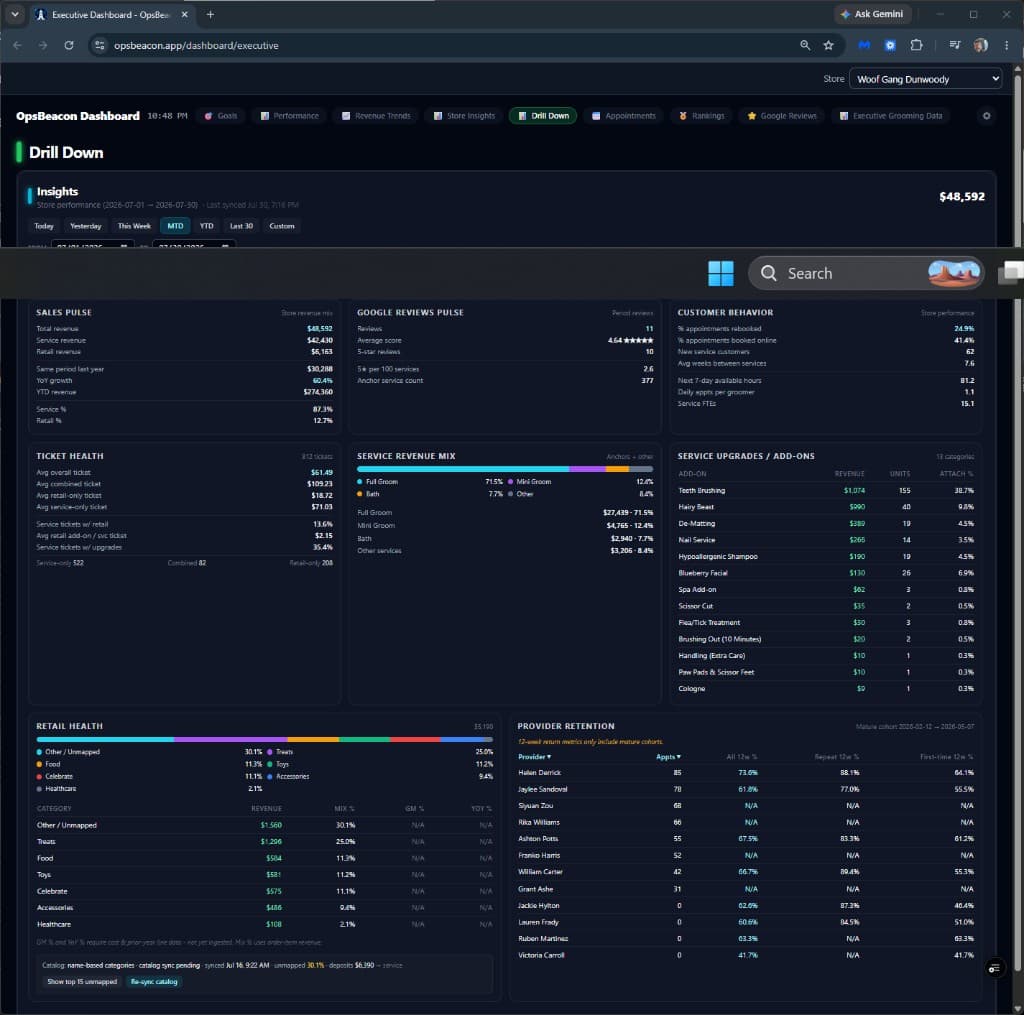
Executive vs. staff TV preset
- Owners control the store-wide Executive slide list from Admin → Dashboard / TV Slides. Use the dashboard target dropdown at the top of that page to switch between Staff TV and Executive presets.
- Managers see the Executive Dashboard with their own saved slide on/off and ordering preferences (same gear-menu behavior as staff on the TV Dashboard).
- Staff use My Home, My Grooming Dashboard (linked groomers), or the store TV slideshow - not the Executive view.
Retail floor TVs
My Grooming Dashboard
A mobile-first, groomer-only view - your approved widgets and your data only.
Open it from the My Dashboard button on My Home or go directly to /groomer/dashboard. The page title is My Grooming Dashboard; the button label on small screens is shortened to My Dashboard.
Who can access it
- Your store login must be linked to a team member in Admin → Team Access
- That team member's Ops Intelligence role must be Groomer (configured under Ops Intelligence → Team members)
- Owners and managers are sent to the Executive Dashboard instead - this view is for floor groomers
What groomers see (and what they don't)
My Grooming Dashboard is locked down on the server. Groomers only receive widgets management has explicitly approved, and every widget only loads their own scoped data - never storewide reporting, other groomers' numbers, revenue leaderboards for the whole salon, or admin screens unless a widget was built and approved for groomer use.
Security
Groomer Progress report
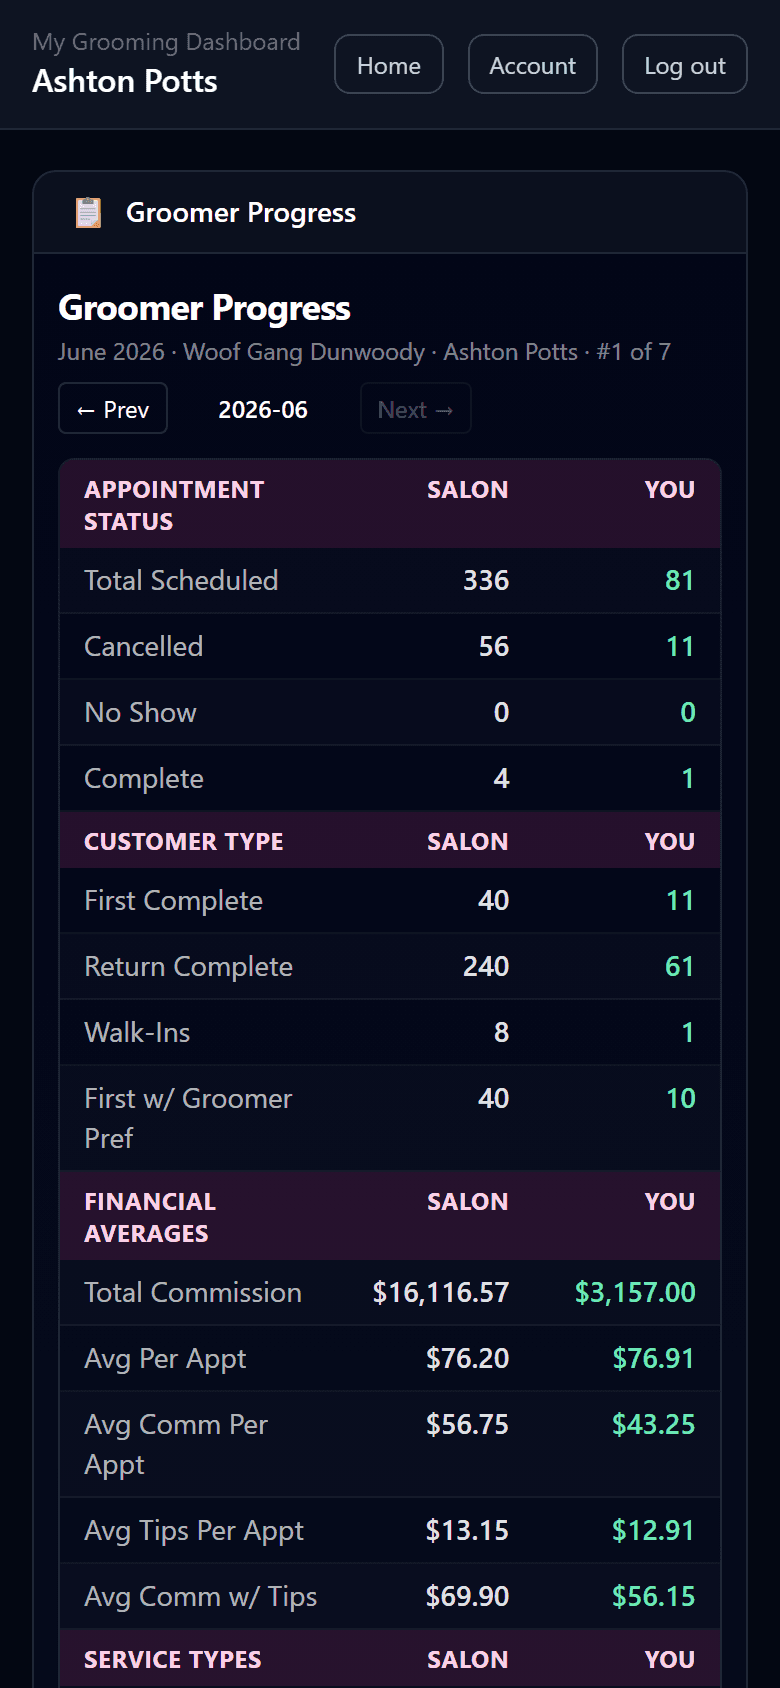
The primary approved widget today is Groomer Progress - a monthly store-vs-you progress report (similar to a salon spreadsheet), including:
- Appointment Status, Customer Type, Financial Averages, Service Types, Dog Sizes, Coat Types, and Complex Size Breakdown - each section compares Salon vs You
- Rankings Highlights (MTD) - compares #1 (top groomer by MTD revenue, no name shown) vs You
- Add-ons & Upgrades Breakdown - salon vs you counts by category
- 12-Month Trends - salon vs you charts (load in the background after the main table appears)
Use ← Prev / Next → to change months. Financial commission uses FranPOS commission data when available; otherwise it estimates from MTD booked revenue and the groomer's configured commission rate in Team members.
Empty or locked states
- No dashboard slides have been approved for your view yet. - management has not enabled any widgets for groomers
- This dashboard is private and only shows information approved for your role. - you are not linked as a groomer, the feature is disabled, or your account is not eligible
Management: Groomer Mobile Dashboard settings
Owners and managers configure groomer access under Admin → Dashboard / TV Slides → Groomer Mobile Dashboard:
- Enable groomer mobile dashboard - master on/off for the store
- Approved widgets - checkboxes for each groomer-safe widget (only widgets that support self-scoped data appear)
- Preview by signing in as a linked groomer and opening My Grooming Dashboard
Groomer Progress can also be added to a custom TV slide for owners/managers in the Custom Slide Builder; on My Grooming Dashboard it always shows only the signed-in groomer's data.
OpsBeacon mobile app
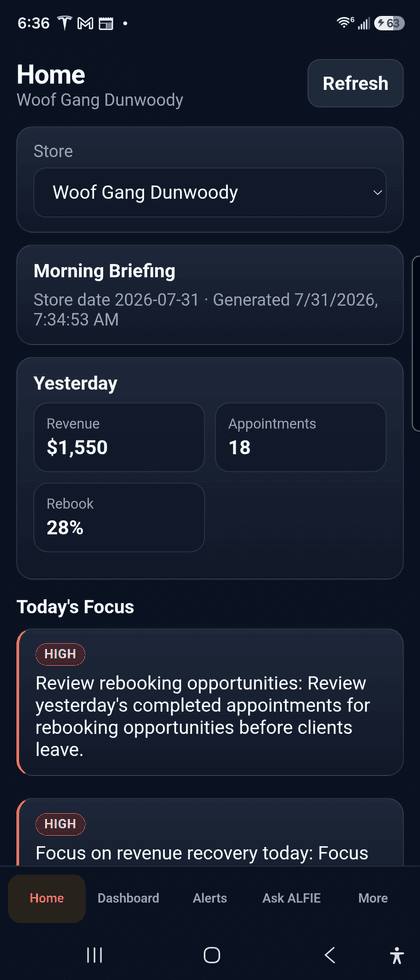
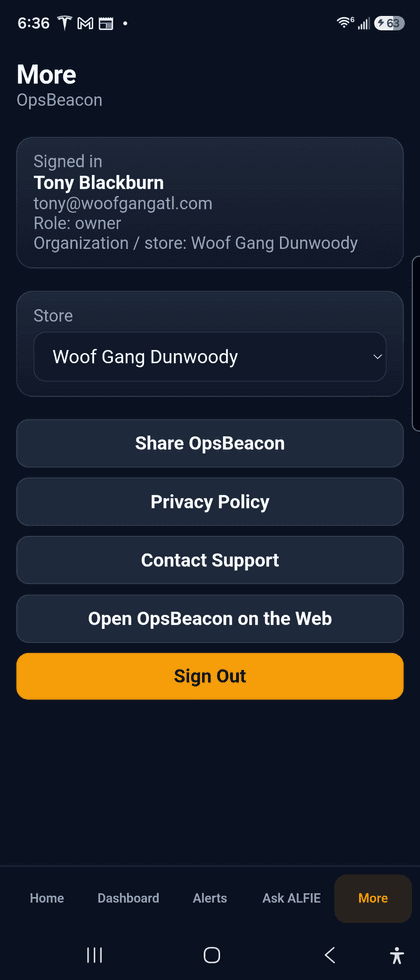
Companion Android app for store staff - Home, Alerts, Supplies, Pay, and More.
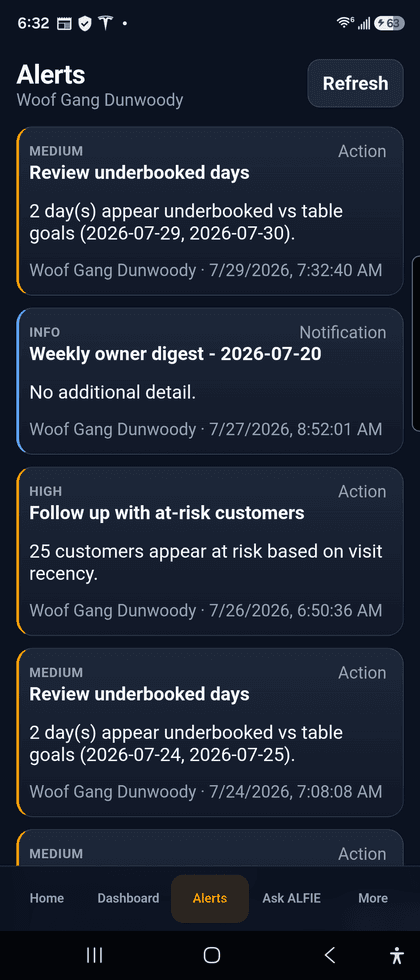
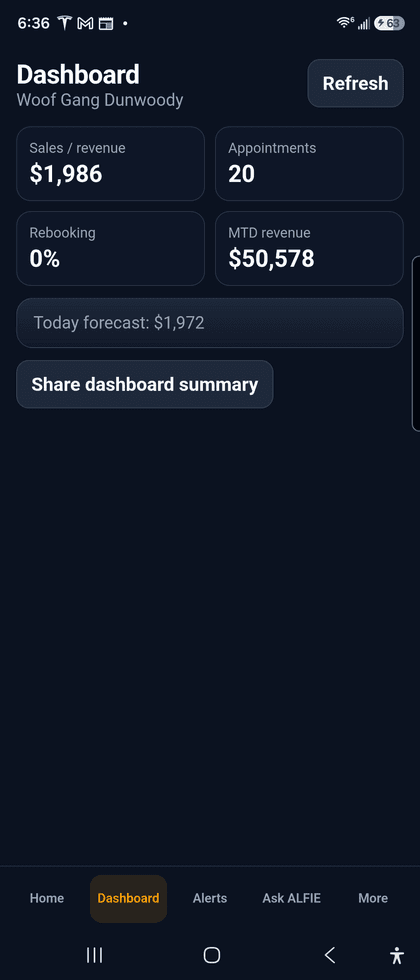
The OpsBeacon mobile app is listed as Coming soon on Google Play and the App Store. Linked team members sign in with the same store credentials used on the web. Typical screens:
- Home - today's snapshot and quick links
- Alerts - action and notification review
- Dashboard / Today - role-aware day view
- Supplies - Order Request style supply workflow when enabled
- Pay - pay period estimates and finalized detail for linked groomers
- More - support, about, and account links
Web vs app
Admin panel
Your control center for store data, team, and settings.
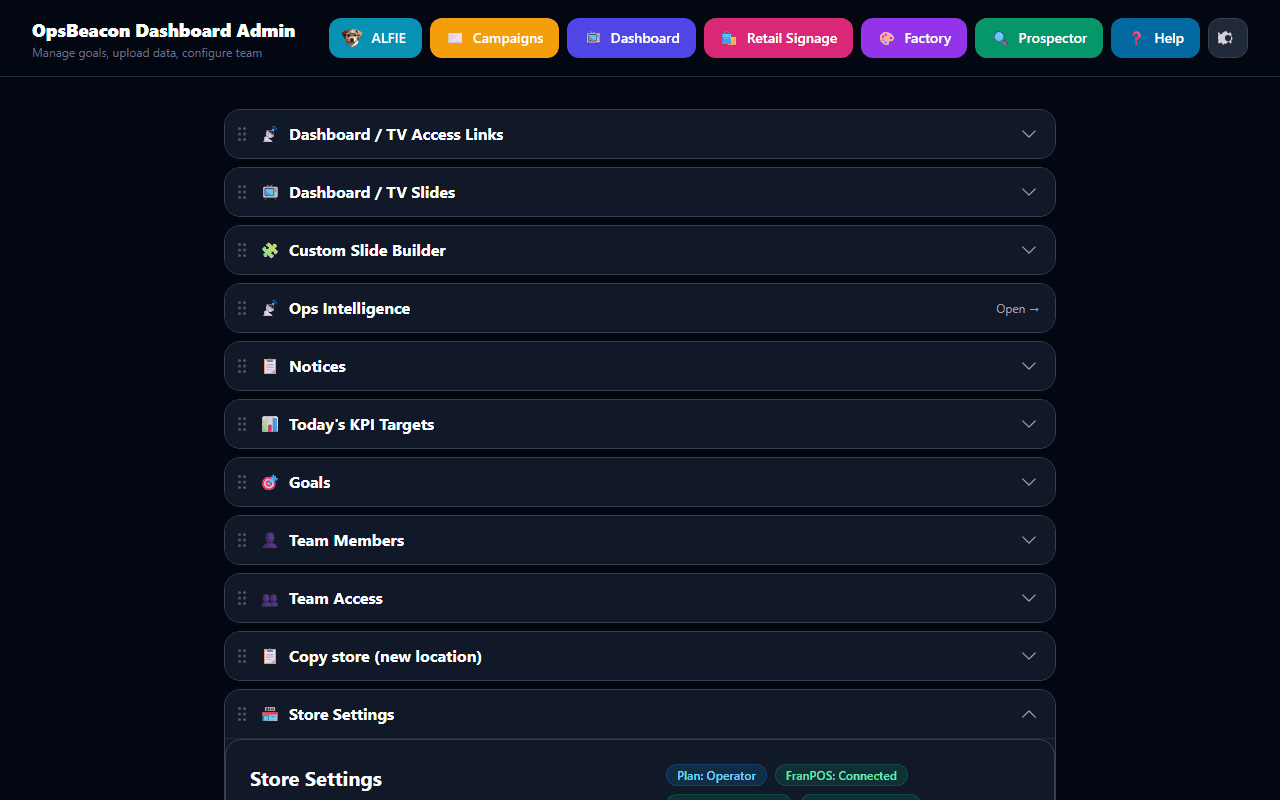
Open Admin from the navigation bar or go to /admin. Here's what you can do:
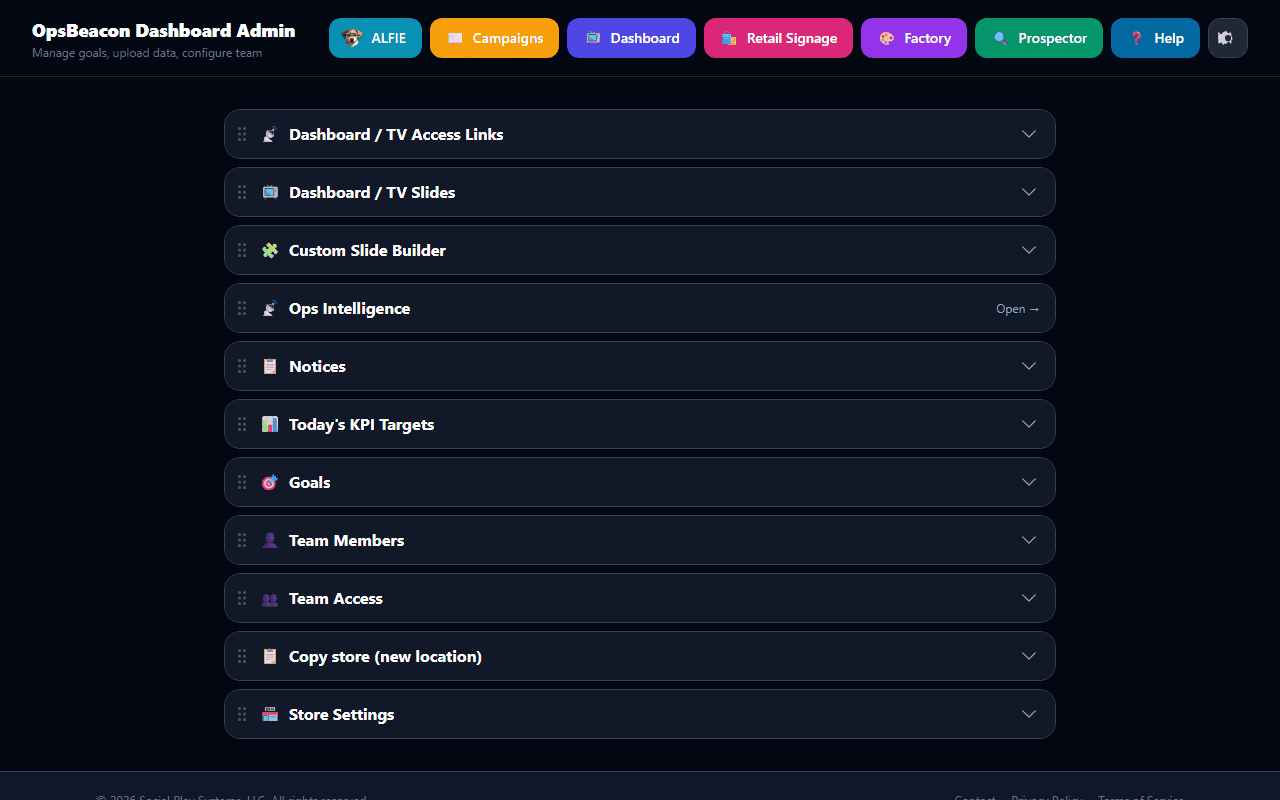
- Store Settings - tabbed store configuration (Overview, Billing, Business Profile, Integrations, Dashboard Display, Grooming Capacity). See Store Settings.
- TV Access Links - generate shareable Staff TV and Retail TV tokens, plus optional named additional Staff dashboards. See TV access links.
- Dashboard / TV Slides - a unified management page listing every slide that can appear on the TV (built-in and every custom slide you've built). Owners can:
- Switch the dashboard target between Staff TV and Executive
- Toggle any slide on or off for the whole store
- Reorder slides with the up / down arrows
- Duplicate a custom slide to use it as a starting point for a new one
- Edit a custom slide (jumps straight into the Custom Slide Builder)
- Delete a custom slide
- Set the global slide rotation interval (seconds per slide)
- Groomer Mobile Dashboard - enable the groomer phone view and approve self-scoped widgets (see My Grooming Dashboard)
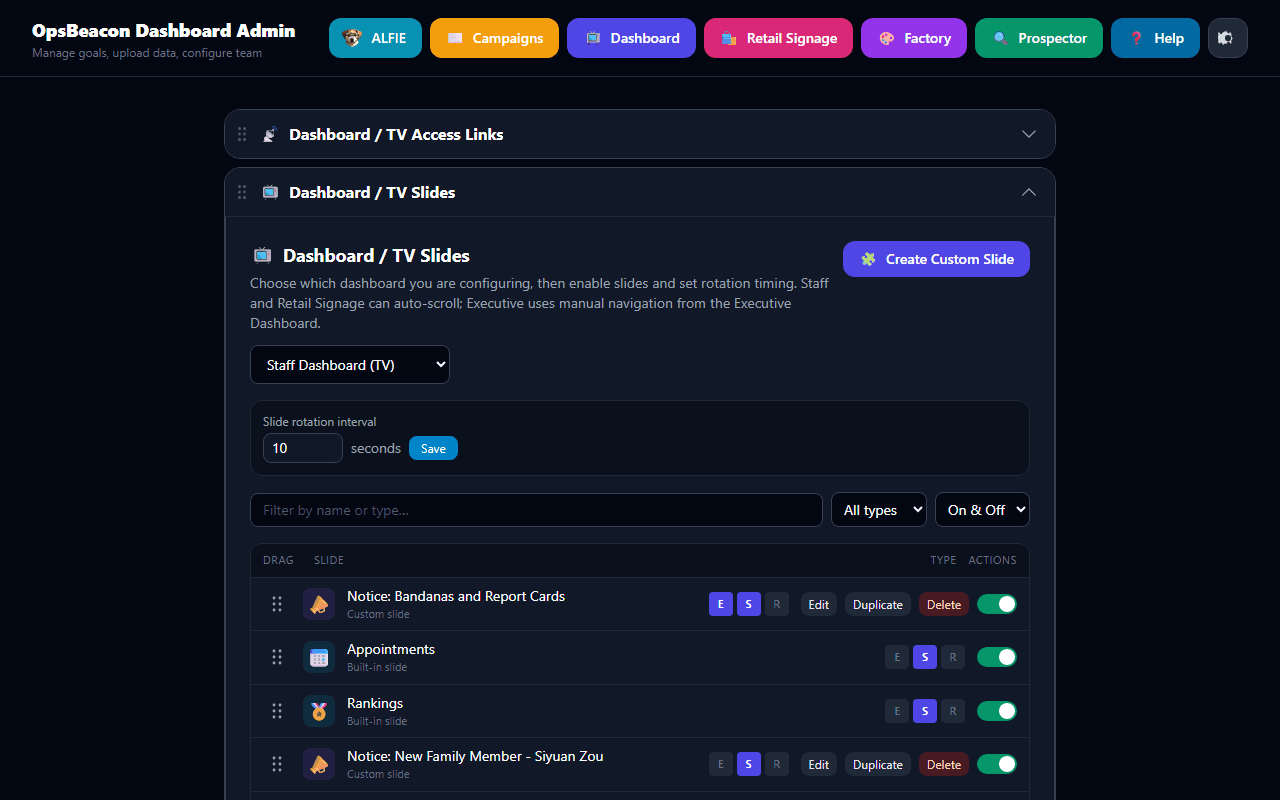
Toggle, reorder, and configure slides for Staff TV and Executive presets. - Custom Slide Builder - click Create Custom Slide on the TV Slides page (or open the Custom Slide Builder accordion) to build your own slides by dropping widgets onto a canvas. See the Custom Slide Builder section below.
- Retail Signage - design customer-facing retail TV layouts and assign them to screen tokens. See Retail Signage.
- Notices - post announcements for staff TVs. Display them with a Team Notices or Single Pinned Notice widget. Retail-type notices can be moved into Retail Signage as a layout (they no longer auto-appear on staff TV).
- Data Uploads - upload CSV or Excel files exported from FranPOS (Sales, Appointment, Monthly-Sales, and Metrics reports) to import KPI and appointment history. The onboarding YTD import uses this same pipeline.
- Sync from FranPOS - pull the latest data directly from the FranPOS API using your store's credentials. No file upload needed. (MoeGo stores use the POS vendor sync path configured under Integrations.)
- KPI Targets - set monthly and per-day-of-week targets for revenue, grooming count, average ticket, and other metrics. These targets power the Goals slide, Pulse orbs, and the Today vs Target widget.
- Goals - define daily or monthly goals that show up on the Goals slide and that you can pin individually on custom slides via the Goal Progress widget.
- Team Members - manage display names used for Google Review mention matching on leaderboards (separate from Ops Intelligence pay-rate team members).
- Team Access - invite new staff members by email and assign roles (owner, manager, or staff). Only owners can add or remove team members. Link logins to payroll team members so groomers unlock My Grooming Dashboard.
- Employee Scheduling - view FranPOS staff schedules on Dashboard; edit, copy, duplicate, and approve time-off on Growth or Operator. See Employee Scheduling.
- Staff Time Clock - turn on clock in and out for linked staff (Growth or higher). See Staff Time Clock.
- Order Request - enable supply ordering, manage catalog, and review open requests. Staff use /order-request or the kiosk PIN link. See Order Request.
- Ops Intelligence - ALFIE-powered operations tools: Daily Workflow, Actions, Owner Briefing, Weekly Owner Review, Notifications, plus advanced tools for anomalies, capacity, Pay Sheets, P&L, Sales Tax, Inventory, and more. See the Ops Intelligence section.
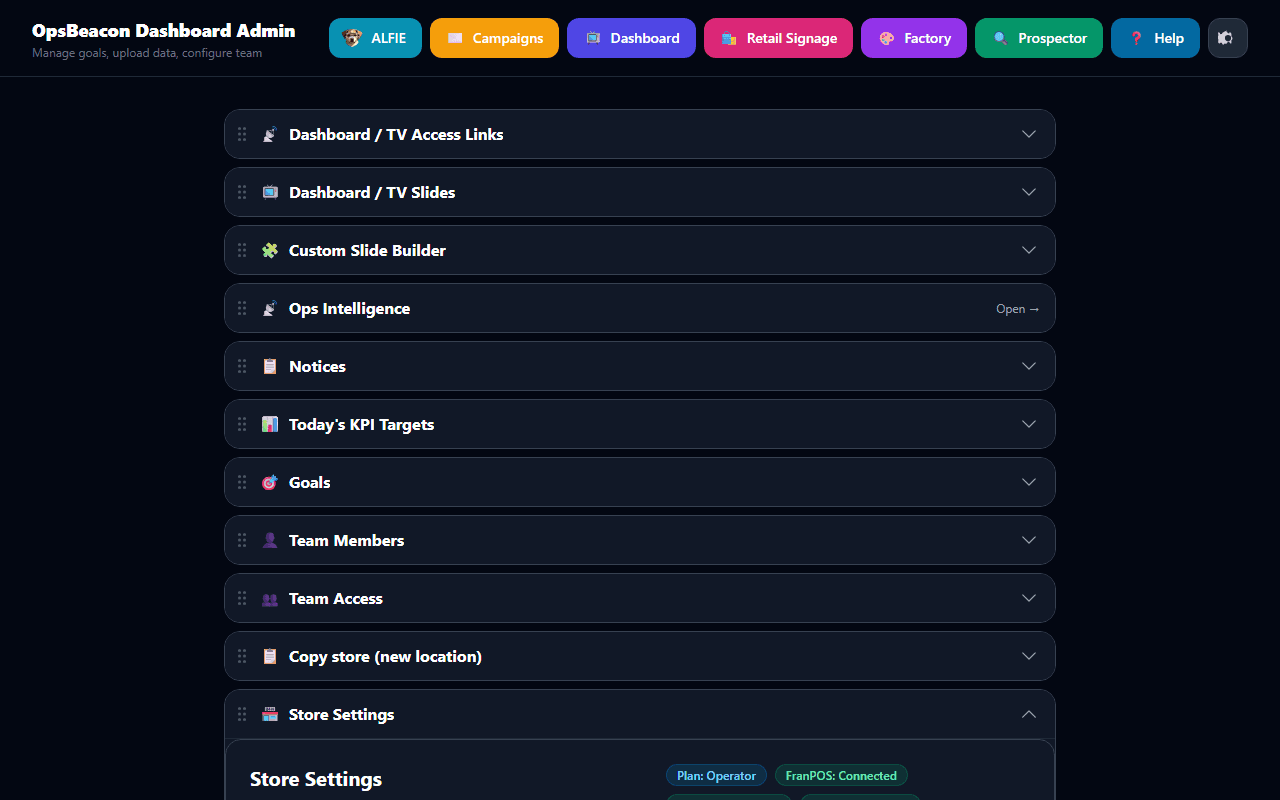
Store Settings
Tabbed settings for billing, profile, integrations, display, and grooming capacity.
Open Admin → Store & Billing (or expand the Store Settings card). Owners can edit; managers typically view. Tabs include:
- Overview - plan status, integration health checklist, quick links to fix missing setup
- Billing & subscription - plan summary and link to Stripe checkout / Customer Portal
- Business Profile - store name, logo, phone, booking URL, city/state (needed for payroll tax estimates), brand colors, royalty/ad fee fields
- Integrations - FranPOS or MoeGo POS credentials, Google Reviews Place ID, SOCi (for Factory social publish)
- Dashboard Display - Staff TV rotation interval, Google Reviews bonus column and dollar amount
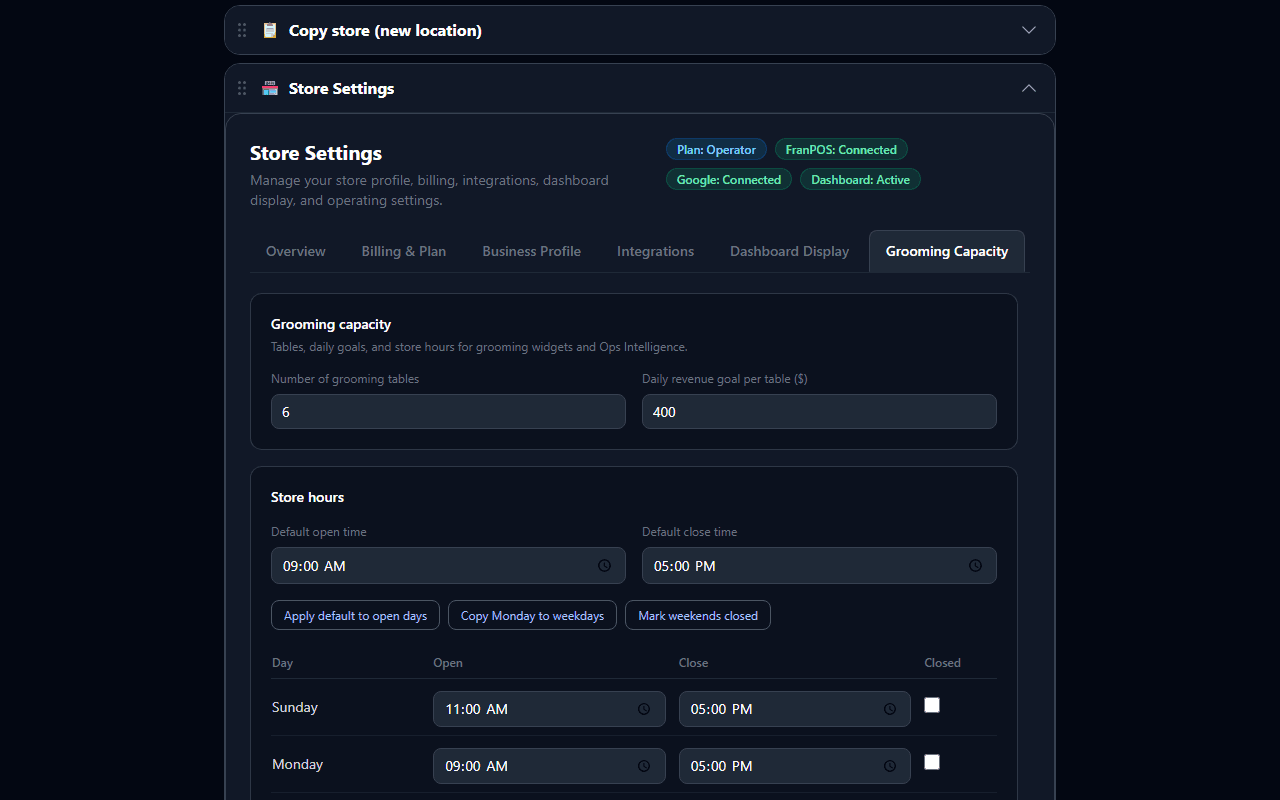
- Grooming Capacity - table count, daily goal per table, store hours (see Grooming & store hours)
Store Settings Overview tab
public/help/store-settings-overview.png
Add this PNG to the help folder, then remove pending from the guide.
Business Profile settings
public/help/store-settings-profile.png
Add this PNG to the help folder, then remove pending from the guide.
Advanced tab
TV access links
Shareable tokens that auto-sign a store TV into Staff or Retail playback without a password.
Open Admin → Dashboard / TV Access Link. Generate or rotate a Staff TV link and (when used) a Retail TV link. Opening /tv/{token} on a wall display binds that browser to the matching dashboard until you revoke or rotate the token.
- Staff TV - grooming floor slideshow from the Staff TV slide preset
- Retail TV - plays published Retail Signage layouts assigned to that screen
- Additional Staff dashboards - create named instances with their own slide lists when one store needs multiple Staff TVs with different content
TV Access Links and additional dashboards
public/help/tv-access.png
Add this PNG to the help folder, then remove pending from the guide.
Treat TV links like keys
Retail Signage
Customer-facing retail TV designs - separate from grooming Staff TV and Executive slides.
Open /admin/retail-marketing (Retail Marketing Dashboard). Typical flow:
Retail Marketing Dashboard
public/help/retail-marketing.png
Add this PNG to the help folder, then remove pending from the guide.
Ops Intelligence
ALFIE-powered back-office tools for spotting booking issues, understanding capacity, estimating groomer pay, and reviewing store-level profit & loss.
Open from Admin → Ops Intelligence or /admin/ops-intelligence. Available to owners and managers only.
Important
Getting started
Daily Workflow - Customer Follow-Up
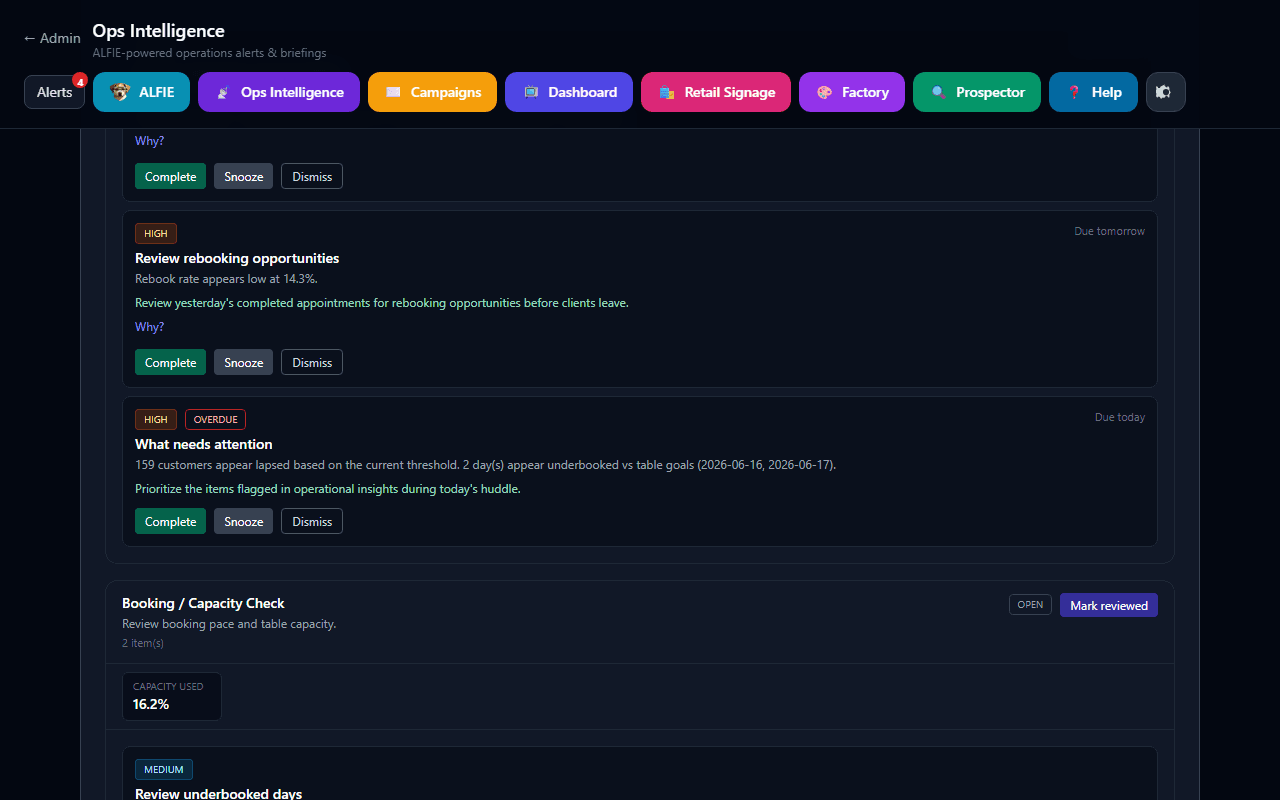
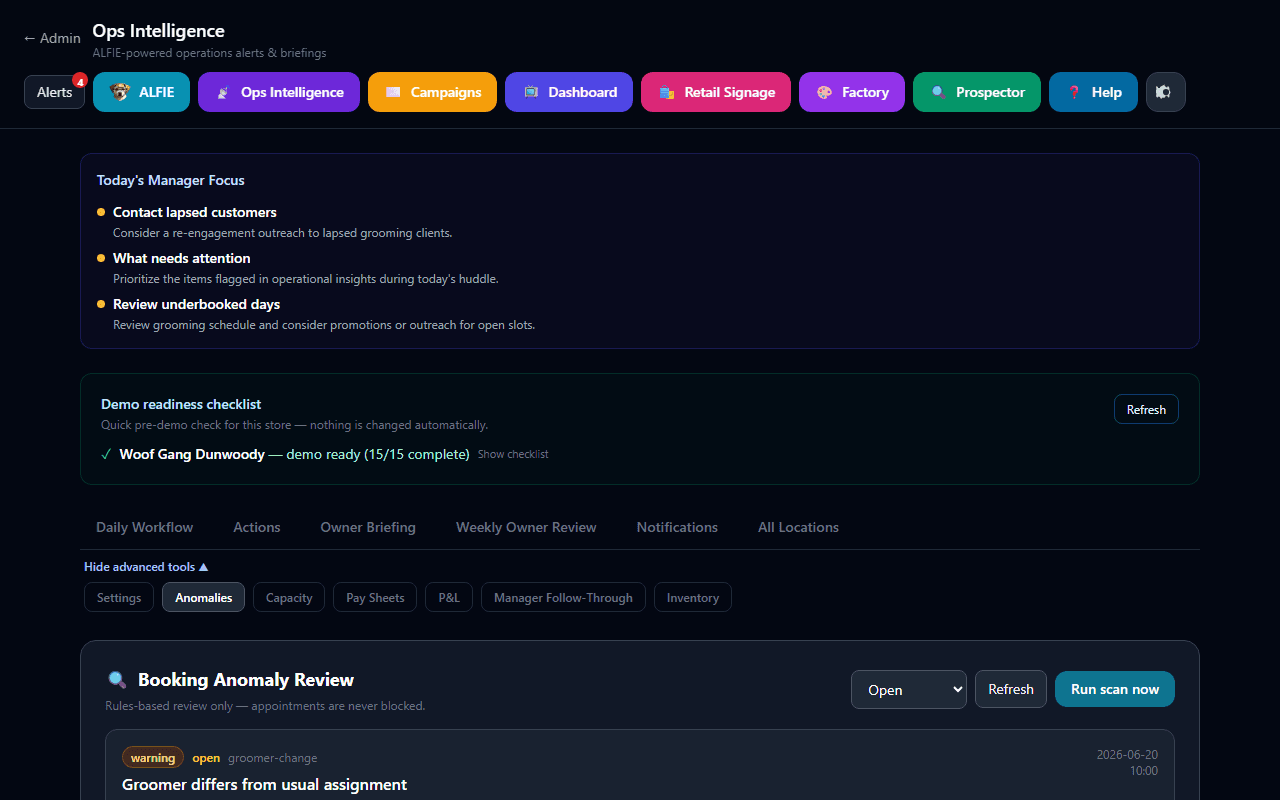
The Daily Workflow tab surfaces rebooking opportunities, including lapsed and at-risk customers. Cards like "Contact lapsed customers" summarize how many clients need outreach, but the full list lives in Customer CRM.
- Click Open CRM on the Customer Follow-Up section or Open in CRM → on any follow-up card
- Regenerate today's workflow after updates if cards do not yet show CRM links
Actions tab - recommended next steps
The Actions tab is a living checklist of recommended store actions (from your daily ops cycle and related alerts). Open an action to see context, mark it complete, or jump to the related tool (CRM, Anomalies, Capacity, and so on). Generate or refresh actions from the workflow when automation is enabled under Settings.
Ops Intelligence Actions tab
public/help/ops-actions.png
Add this PNG to the help folder, then remove pending from the guide.
Weekly Owner Review
Owners use Weekly Owner Review for a week-over-week digest of KPIs, open actions, and highlights. Preview the report in-app and open the printable weekly report when you need a PDF-friendly view. Pair this with Daily Ops Cycle / Weekly Owner Cycle toggles under Advanced → Settings when you want automation to prepare the digest.
Weekly Owner Review tab
public/help/ops-weekly-review.png
Add this PNG to the help folder, then remove pending from the guide.
Notifications
The Notifications tab is your in-app center for briefing deliveries, weekly digests, and action reminders. Click a notification to jump to the related Ops Intelligence tab.
Ops Intelligence Notifications tab
public/help/ops-notifications.png
Add this PNG to the help folder, then remove pending from the guide.
Anomalies tab - booking review (advanced)
Scans upcoming appointments (default: 7 days ahead) and flags patterns that differ from a pet's history. Appointments are never blocked - this is a review queue only.
- Service deviation - pet usually gets Full Groom but is booked for Bath or Mini Groom
- Groomer change - assigned groomer differs from the pet's usual groomer
- Missing common add-on - historical add-ons (nail grind, teeth brushing, etc.) not reflected in the service text
- Size tier change - small/medium/large tier differs from visit history
- Unusual duration - service pattern suggests a very different appointment length
Use Run scan now for an immediate check, or rely on automatic scanning when enabled. Filter by status (Open / Reviewed / Dismissed), then Mark reviewed or Dismiss each item. Dismissed and reviewed items are not recreated on future scans.
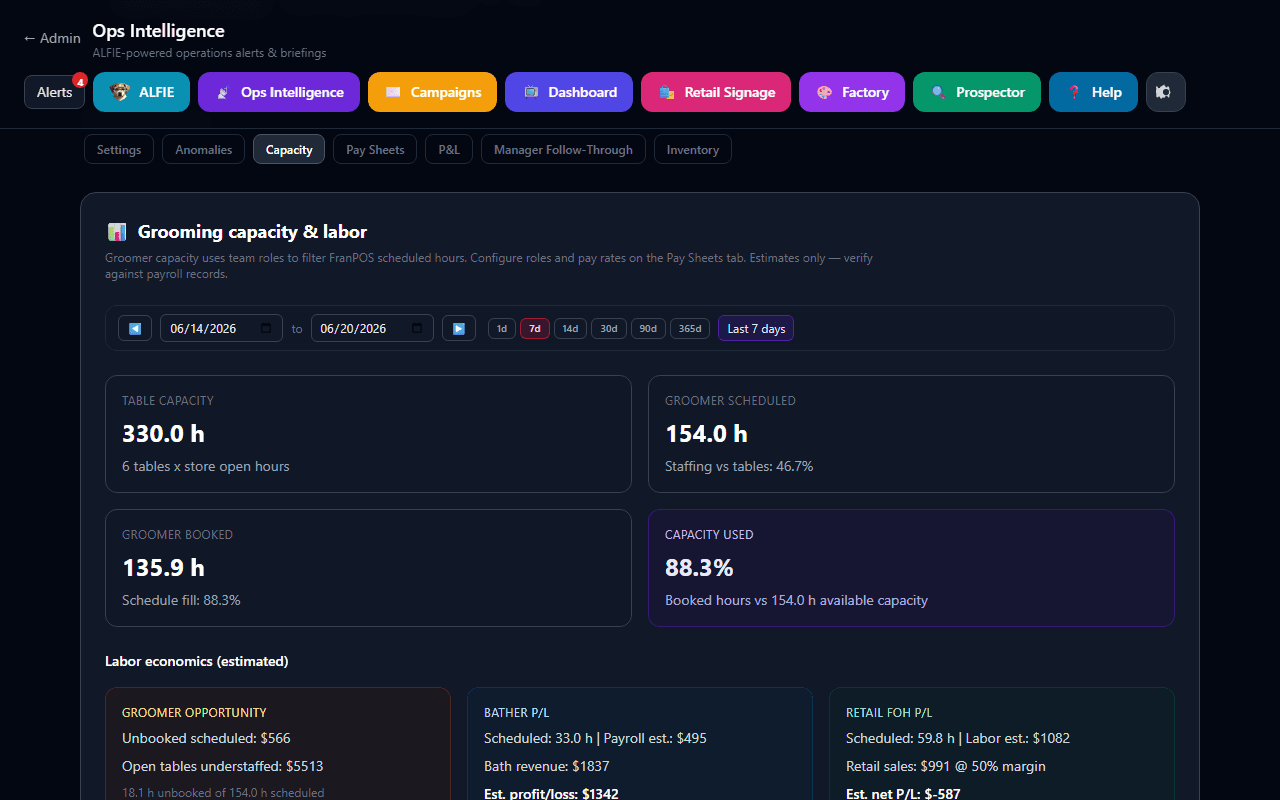
Capacity tab - grooming capacity & labor
Shows how fully booked your grooming operation is over any date range (defaults to the last 7 days). Key metrics:
- Table capacity - grooming tables × store open hours
- Groomer scheduled - FranPOS scheduled hours for team members with the Groomer role
- Groomer booked - hours filled by appointments
- Capacity used - booked hours vs. available groomer capacity
When team pay rates are configured, the panel also shows estimated labor economics: groomer opportunity loss (unbooked schedule, understaffed tables), bather profit/loss, and retail front-of-house P/L. Bather bath revenue counts only bath line items attributed to active bathers in FranPOS (groomer-performed baths are excluded; no grooming-sales estimate). Retail FOH labor includes every active retail team member: hourly staff use scheduled or time-clock hours, and salaried staff use prorated salary for the period. If FranPOS shows employees not yet in your team roster, click + Add [name] to jump to Pay Sheets with that name pre-filled.
Morning Briefing / Owner Briefing tab - daily email
ALFIE compiles a daily owner summary - yesterday's KPIs, open anomalies, capacity snapshot, goal progress, rankings highlights, Order Request digests when enabled, and an optional plain-English narrative. Manager Huddle Briefing is a separate recipient list under automation settings for managers (not the Owner Briefing list).
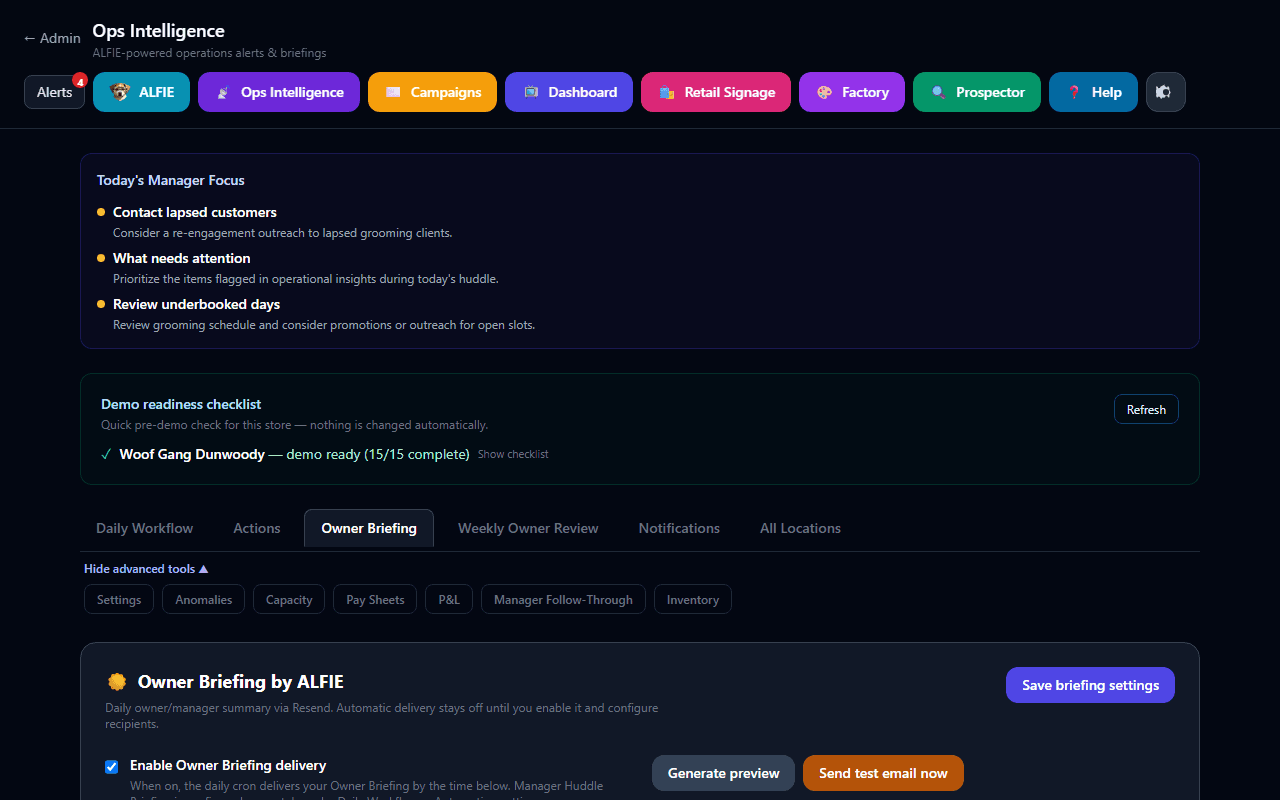
Past briefings appear in the history list - click any row to reopen its HTML snapshot.
Pay Sheets tab - pay period estimates
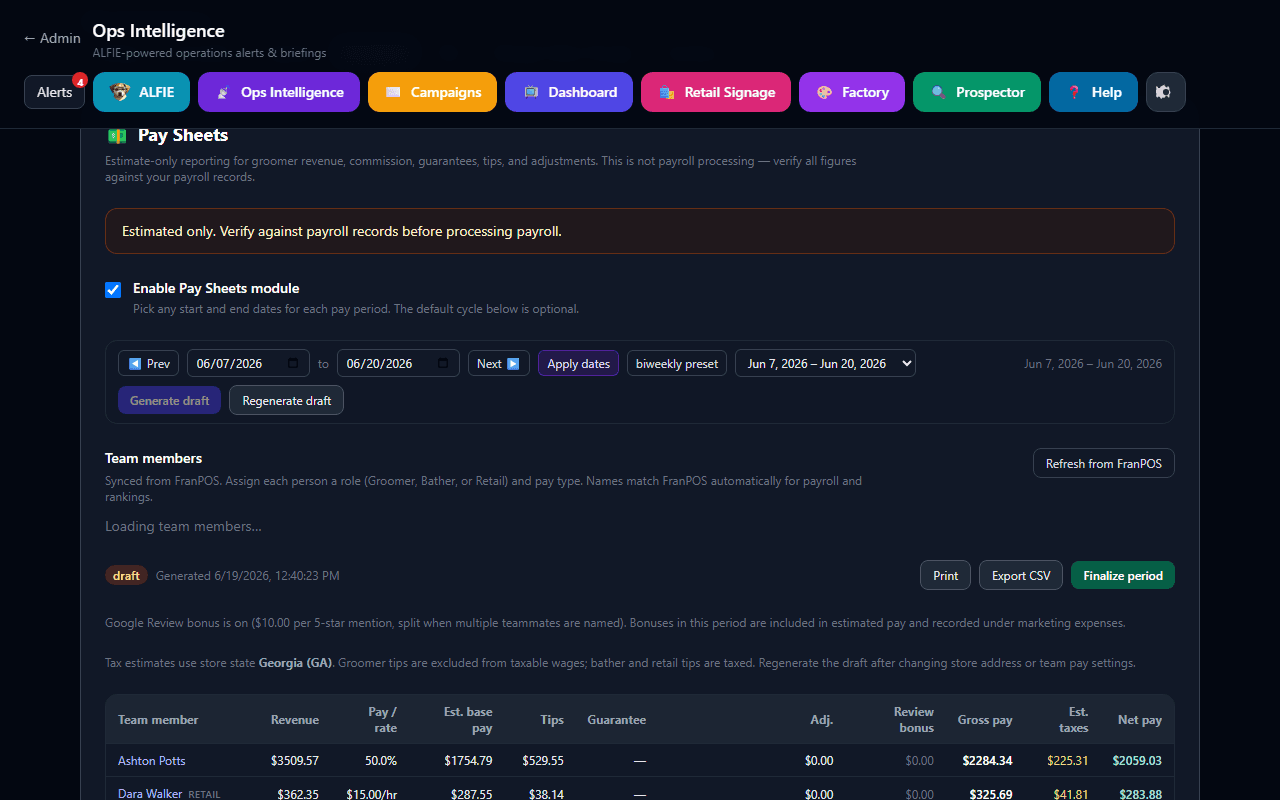
Pulls FranPOS revenue, tips, and your configured pay rates to produce an estimate-only pay sheet for any date range.
Choosing a payroll provider
Each store selects one payroll path on Admin → Ops Intelligence → Pay Sheets. OpsBeacon then shows integration settings, submit/sync buttons, and in-app help for that provider only. You can change the selection later; finalized pay periods keep their history.
- 1Enable Ops Intelligence and the Pay Sheets module.
- 2Under Payroll provider, choose Estimates only, ADP Workforce Now (coming soon), QuickBooks Online Payroll (coming soon), Gusto (coming soon), or Paychex (coming soon). Store owners use Estimates only until integrations roll out.
- 3Open the in-app payroll help panel on Pay Sheets for setup and workflow steps specific to your provider.
- 4Map team members to provider employee IDs when using ADP, QuickBooks, Gusto, or Paychex (see Team access).
ADP Workforce Now (coming soon)
Push finalized pay period data to ADP Workforce Now, run payroll in ADP, then sync employer tax actuals back into OpsBeacon for P&L.
Before you start
- Ops Intelligence and the Pay Sheets module are enabled for your store.
- Team members are configured with roles, pay rates, and names that match FranPOS.
- Your store state is set under Admin → Store & Billing for tax estimates and P&L.
- Your organization has ADP Workforce Now with Pay Data Input and Payroll Output API access.
- OpsBeacon server env vars for ADP OAuth and mTLS certificates are configured by your administrator.
Choose ADP and configure the store
- 1Open Admin → Ops Intelligence → Pay Sheets.
- 2Under Payroll provider, select ADP Workforce Now and save.
- 3Expand ADP settings, enable ADP payroll for this store, and enter your ADP pay group code.
- 4Map earning codes (regular, overtime, commission, tips, bonus) to match your ADP configuration.
- 5Click Test connection to confirm workers are visible.
Map team members
- 1Open Admin → Team Members (or Team members on Pay Sheets).
- 2For each employee, enter ADP file number and associate OID.
- 3Use the ADP workers list API suggestions when names match.
Submit and sync a pay period
- 1Generate and finalize the pay period in Pay Sheets.
- 2Click Submit to ADP to send pay data for mapped employees.
- 3Process payroll in ADP Workforce Now as you normally would.
- 4After ADP completes the run, click Sync ADP taxes on the same pay period.
- 5P&L will use ADP employer tax actuals for dates that overlap synced periods.
Team mapping: Each team member needs adpFileNumber and optionally adpAssociateOid from ADP Workforce Now.
P&L: When taxSnapshot.source is adp, P&L uses prorated employer labor cost from ADP-synced actuals instead of flat estimates.
Common issues
Submit to ADP is disabled or missing
Confirm Payroll provider is set to ADP, ADP is enabled with a pay group code, and the period is finalized. Only store owners can submit.
Sync failed after ADP processed payroll
Wait until ADP finishes the payroll run, then sync again. Verify the pay group code matches the run in ADP.
QuickBooks Online Payroll (coming soon)
Connect QuickBooks Online Payroll, submit time activities from finalized pay periods, run payroll in QBO, then sync payslip taxes into OpsBeacon.
Before you start
- Ops Intelligence and the Pay Sheets module are enabled for your store.
- Team members are configured with roles, pay rates, and names that match FranPOS.
- Your store state is set under Admin → Store & Billing for tax estimates and P&L.
- Your store uses QuickBooks Online with Payroll (partner API access may be required for payslip sync).
- OpsBeacon server env vars QUICKBOOKS_CLIENT_ID and QUICKBOOKS_CLIENT_SECRET are configured.
Choose QuickBooks and connect
- 1Open Admin → Ops Intelligence → Pay Sheets.
- 2Under Payroll provider, select QuickBooks Online Payroll and save.
- 3Click Connect QuickBooks and sign in with the QBO company that runs payroll.
- 4Enable QuickBooks payroll for this store and map compensation type names.
- 5Click Test connection to confirm employees are visible.
Map team members
- 1Open Admin → Team Members.
- 2Enter the QuickBooks Employee.Id for each team member.
- 3Use name-match suggestions from the QuickBooks employees API when available.
Submit and sync a pay period
- 1Generate and finalize the pay period in Pay Sheets.
- 2Click Submit to QuickBooks to create time activities for mapped employees.
- 3Run payroll in QuickBooks Online as you normally would.
- 4After payslips are available, click Sync QuickBooks taxes on the pay period.
- 5P&L will use QuickBooks employer tax actuals for overlapping dates.
Team mapping: Each team member needs quickbooksEmployeeId (QuickBooks Employee.Id).
P&L: When taxSnapshot.source is quickbooks, P&L uses prorated employer labor cost from synced payslip taxes.
Common issues
QuickBooks connect failed
Verify the redirect URI in your Intuit app matches {APP_URL}/api/ops-intelligence/payroll/quickbooks/callback and that payroll scopes are enabled.
Sync returns no payslip data
Complete payroll in QuickBooks first. Payslip APIs may require production partner access from Intuit.
Gusto (coming soon)
Connect Gusto, submit employee compensations to an unprocessed Gusto payroll, review and process in Gusto, then sync calculated tax results.
Before you start
- Ops Intelligence and the Pay Sheets module are enabled for your store.
- Team members are configured with roles, pay rates, and names that match FranPOS.
- Your store state is set under Admin → Store & Billing for tax estimates and P&L.
- Your store uses Gusto with a regular payroll schedule that overlaps OpsBeacon pay periods.
- OpsBeacon server env vars GUSTO_CLIENT_ID and GUSTO_CLIENT_SECRET are configured.
Choose Gusto and connect
- 1Open Admin → Ops Intelligence → Pay Sheets.
- 2Under Payroll provider, select Gusto and save.
- 3Click Connect Gusto and authorize your Gusto company.
- 4Enable Gusto payroll for this store and map hourly and fixed compensation names to match Gusto job pay types.
- 5Click Test connection to confirm employees are visible.
Map team members
- 1Open Admin → Team Members.
- 2Enter the Gusto employee UUID for each team member.
- 3Use name-match suggestions from the Gusto employees list when available.
Submit and sync a pay period
- 1Ensure an unprocessed Gusto payroll exists with dates overlapping the OpsBeacon period.
- 2Generate and finalize the pay period in Pay Sheets.
- 3Click Submit to Gusto to prepare, update compensations, and calculate in Gusto.
- 4Review and process payroll in the Gusto UI (final processing cannot be done via API).
- 5Click Sync Gusto taxes after Gusto finishes calculation.
- 6P&L will use Gusto employer tax actuals for overlapping dates.
Team mapping: Each team member needs gustoEmployeeUuid from Gusto.
P&L: When taxSnapshot.source is gusto, P&L uses prorated employer labor cost from Gusto-synced calculated payroll.
Common issues
No unprocessed Gusto payroll found
Create or open a regular payroll in Gusto with pay dates that overlap the OpsBeacon period before submitting.
Sync says calculation is still in progress
Wait for Gusto to finish calculating, complete any required review in Gusto, then sync again.
Paychex (coming soon)
Connect Paychex, submit worker compensations to an unprocessed Paychex payroll, review and process in Paychex, then sync calculated tax results.
Before you start
- Ops Intelligence and the Pay Sheets module are enabled for your store.
- Team members are configured with roles, pay rates, and names that match FranPOS.
- Your store state is set under Admin → Store & Billing for tax estimates and P&L.
- Your store uses Paychex Flex with a regular payroll schedule that overlaps OpsBeacon pay periods.
- OpsBeacon server env vars PAYCHEX_CLIENT_ID and PAYCHEX_CLIENT_SECRET are configured.
Choose Paychex and connect
- 1Open Admin → Ops Intelligence → Pay Sheets.
- 2Under Payroll provider, select Paychex and save (super admin testing only until rollout).
- 3Click Connect Paychex and authorize your Paychex company.
- 4Enable Paychex payroll for this store and map hourly and fixed compensation names to match Paychex pay types.
- 5Click Test connection to confirm workers are visible.
Map team members
- 1Open Admin → Team Members.
- 2Enter the Paychex worker ID for each team member.
- 3Use name-match suggestions from the Paychex workers list when available.
Submit and sync a pay period
- 1Ensure an unprocessed Paychex payroll exists with dates overlapping the OpsBeacon period.
- 2Generate and finalize the pay period in Pay Sheets.
- 3Click Submit to Paychex to prepare, update compensations, and calculate in Paychex.
- 4Review and process payroll in the Paychex UI.
- 5Click Sync Paychex taxes after Paychex finishes calculation.
- 6P&L will use Paychex employer tax actuals for overlapping dates.
Team mapping: Each team member needs paychexWorkerId from Paychex.
P&L: When taxSnapshot.source is paychex, P&L uses prorated employer labor cost from Paychex-synced calculated payroll.
Common issues
No unprocessed Paychex payroll found
Create or open a regular payroll in Paychex with pay dates that overlap the OpsBeacon period before submitting.
Sync says calculation is still in progress
Wait for Paychex to finish calculating, complete any required review in Paychex, then sync again.
Estimates only
Generate and finalize Pay Sheets using OpsBeacon estimates only. Export CSV or print reports for your accountant or payroll processor.
Before you start
- Ops Intelligence and the Pay Sheets module are enabled for your store.
- Team members are configured with roles, pay rates, and names that match FranPOS.
- Your store state is set under Admin → Store & Billing for tax estimates and P&L.
Select estimates only
- 1Open Admin → Ops Intelligence → Pay Sheets.
- 2Under Payroll provider, choose Estimates only and save.
Typical pay period workflow
- 1Configure team members and generate a pay period draft.
- 2Review gross pay, estimated taxes, and net pay.
- 3Add manual adjustments while the period is still a draft.
- 4Finalize the period when you are satisfied with the estimates.
- 5Export CSV or print reports and enter totals in your external payroll system manually.
Team mapping: No provider employee IDs are required. Map FranPOS names to team members so revenue and hours aggregate correctly.
P&L: P&L uses prorated employer labor cost from Pay Sheets tax estimates (gross pay plus estimated employer taxes) for overlapping finalized periods.
Common issues
Can I switch to ADP, QuickBooks, Gusto, or Paychex later?
Payroll integrations are coming soon. When they roll out, store owners will choose a provider on Pay Sheets, map team members, and use Submit and Sync on finalized periods. Super admins can test integrations before general availability.
Pay calculation notes
Payroll tax estimates (by store state)
When you Generate draft or Regenerate draft, OpsBeacon estimates payroll taxes using your store's state from Admin → Store & Billing (city/state on the store profile). If state is missing, a default US estimate is used and a warning appears on the pay sheet.
- Groomers - tips are included in gross pay but excluded from taxable wages (not taxed in the estimate)
- Bather & Retail - tips are taxed like other wages in the estimate
- All roles - commission, hourly, salary, guarantees (when they are the paid base), review bonuses, and manual adjustments count toward taxable wages
Each line shows Est. taxes (employee Social Security, Medicare, and flat state income tax estimate) and Net pay (gross minus employee taxes). Print and CSV exports include taxable wages, employer tax estimates, and employer labor cost (gross pay + employer FICA and state payroll tax estimate).
Tax estimates are not payroll processing
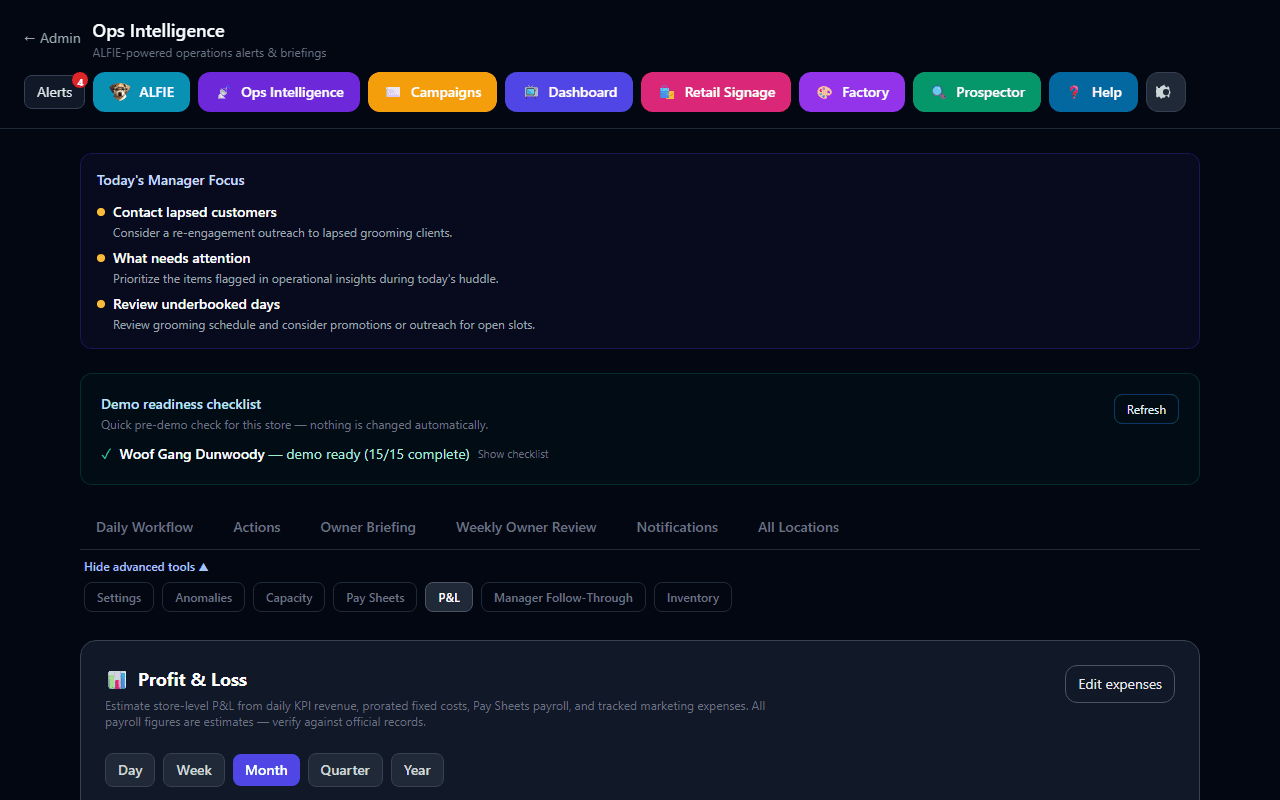
P&L tab - store profit & loss
Builds an estimated store-level profit & loss statement by combining daily KPI revenue with prorated fixed costs and payroll from Pay Sheets. Open Admin → Ops Intelligence, expand Advanced, then select P&L (or use /admin/ops-intelligence?tab=pnl). Owners only - the tab lives under Advanced alongside Capacity and Pay Sheets.
- Revenue - summed from your store's
daily-kpisdocuments (same source as the Performance slide) - Fixed costs - monthly averages prorated across the selected period (week = trailing 7 days; month/quarter/year = calendar boundaries)
- Payroll - prorated from Pay Sheets that overlap the range. Hourly hours on those sheets come from OpsBeacon Staff Time Clock when that feature is on, or from FranPOS time clock when a member has 0 OpsBeacon hours (or the feature is off). When pay sheets include synced ADP, QuickBooks, or Gusto tax actuals, labor cost uses provider employer labor cost (gross wages plus actual employer payroll taxes). Otherwise OpsBeacon uses stored tax estimates or falls back to a capacity-based labor estimate
- Tracked marketing - actual amounts recorded for programs like Google Review bonuses during the period, in addition to your marketing budget line
For accurate payroll in P&L, set your store state, configure team pay on Pay Sheets, regenerate drafts so tax snapshots are current, and finalize periods that overlap your P&L date range.
Plan notes
Sales Tax worksheet (advanced)
The Sales Tax tab builds a filing-style worksheet from your stored sales and tax fields so you can copy values into state forms. It is a worksheet helper - not a tax filing service. Confirm every figure with your CPA or state guidance before remitting.
Sales Tax worksheet
public/help/ops-sales-tax.png
Add this PNG to the help folder, then remove pending from the guide.
Inventory (advanced)
Inventory reviews retail product performance from FranPOS - best sellers, margin clues, and reorder hints. Use date filters and product tables to plan purchase orders. Treat quantities as guidance and verify against your physical counts. On Admin → Inventory → Analysis, export the filtered table as CSV or PDF. On Orders / POs, click Edit to change quantity or unit cost. Staff Ordering System lines already marked ordered show as Ordered and pending receipt, not Draft.
Inventory intelligence tab
public/help/ops-inventory.png
Add this PNG to the help folder, then remove pending from the guide.
Manager Follow-Through (advanced)
Owners use Manager Follow-Through to track whether assigned actions were completed on time. Availability depends on your plan. Pair it with the Actions tab so managers clear daily/weekly follow-ups.
All Locations (multi-store owners)
If your account is linked to more than one store (or a franchise group), All Locations shows scorecards, comparisons, digests, and group automation health. Use the store switcher in the header to jump into a single location for detailed Pay Sheets or Daily Workflow work.
All Locations multi-store command center
public/help/ops-multi-location.png
Add this PNG to the help folder, then remove pending from the guide.
Not covered in this guide
Employee Scheduling
Build and sync weekly staff schedules to FranPOS, and review time-off requests.
Open from Admin → Employee Scheduling or /admin/employee-schedule. Available to owners and managers. Team members must be linked with FranPOS employee IDs under Team Members for their columns to appear.
Employee Scheduling week grid
public/help/employee-schedule.png
Add this PNG to the help folder, then remove pending from the guide.
Edit and save shifts
Time-off and schedule change requests
New staff time-off and schedule change requests also appear under the header Alerts bell. Open the alert to jump to Employee Scheduling for that week. Pending requests appear at the top of the scheduling page. For time off, Reviewjumps the week grid to that request and highlights the day so you can check coverage. Until you approve, the cell shows REQUESTED TIME OFF in yellow. After you approve, it shows APPROVED OFF DAY in green instead of an empty + Add cell. Approve posts the change when applicable and notifies the employee. Approval is blocked if the employee still has bookings on the requested day(s) - clear or reassign those appointments in FranPOS first. Decline with an optional note when needed. Review, Approve, and Reject also require Growth or Operator for the final decision. To enter preapproved time off (or any already-approved days) without a staff request, open + Add and choose Approved time off. Pick the employee, dates, reason, and optional notes, then save. That marks the days approved immediately, clears FranPOS hour cards, and notifies the employee when they have an email.
Pending time-off requests on Employee Scheduling
public/help/employee-schedule-requests.png
Add this PNG to the help folder, then remove pending from the guide.
Staff Time Clock
Let linked staff clock in and out from their OpsBeacon page, and use those punches as the hours source for labor and payroll.
Owners and managers turn the feature on under Admin → Staff Time Clock. Staff then see a banner at the top of My Home and My Grooming Dashboard that shows whether they are clocked in, plus a Clock in or Clock out button.
Staff Time Clock admin toggle
public/help/staff-timeclock-admin.png
Add this PNG to the help folder, then remove pending from the guide.
How staff use it
Staff clock-in banner on My Home
public/help/staff-timeclock-banner.png
Add this PNG to the help folder, then remove pending from the guide.
Owner punch list and forgotten clock-outs
Owners and managers see who is clocked in right now and a punch list for a date range under Admin → Staff Time Clock. They can clock someone out now or save a clock-out time. Open punches older than the forgotten clock-out rule (default 12 hours, configurable from 4 to 24) are auto-closed at clock-in plus that many hours, so a missed clock-out does not keep adding time to Pay Sheets or labor.
Hours for briefings, Pay Sheets, and P&L
When Staff Time Clock is on, OpsBeacon punches are the source of truth for hourly staff hours used by Owner Briefing and Manager Huddle labor, Pay Sheets, and P&L. If a team member has no OpsBeacon clocked-in/out hours for the period (payroll hours = 0), OpsBeacon falls back to the FranPOS time clock for that person. Commission groomer hours still use booked chair time from FranPOS, not the time clock.
Leave it off to keep FranPOS as the clock
Order Request
Let groomers, bathers, and retail staff request supplies from a shared tablet or their phone.
Owners enable and configure Order Request under Admin → Order Request. Staff open /order-request from My Home when linked, or use a shared kiosk URL with their FranPOS PIN.
Order Request admin settings and catalog
public/help/order-request-admin.png
Add this PNG to the help folder, then remove pending from the guide.
Owner / manager setup
?store= when needed) for a shared tablet, or have linked staff open Order Request from My Home.Staff workflow
Order Request staff kiosk home
public/help/order-request-staff.png
Add this PNG to the help folder, then remove pending from the guide.
Order Request Expected Deliveries
public/help/order-request-deliveries.png
Add this PNG to the help folder, then remove pending from the guide.
Email digests
Custom Slide Builder
Design your own TV slides by dragging widgets onto a canvas.
The Custom Slide Builder lives at /admin/slide-builder. You can open it from Admin → Dashboard / TV Slides → Create Custom Slide, or by clicking Edit on an existing custom slide.
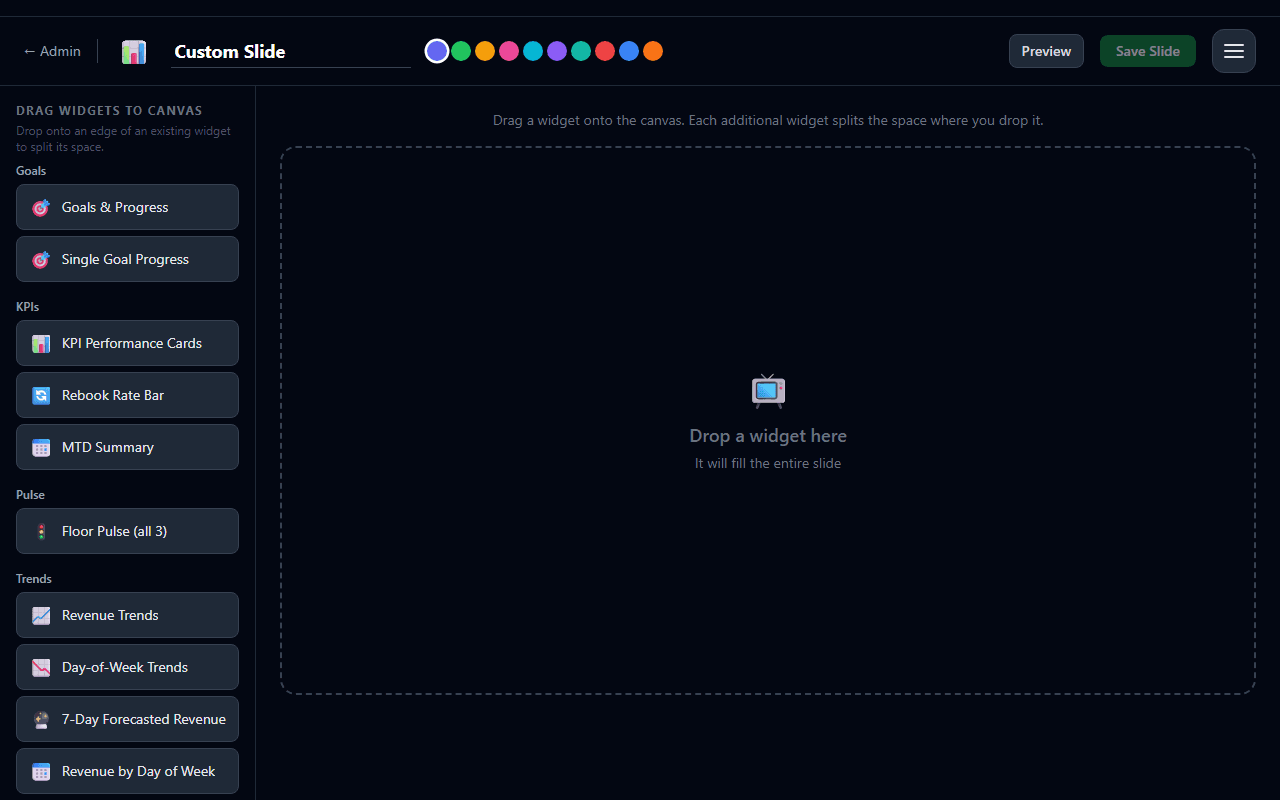
Tiling drag-and-drop layout
The canvas uses a tiling layout - when you drop a widget onto an existing one, the space splits instead of overlapping. Drop near an edge of a widget and a colored preview appears showing how the split will land:
- Drop on the left or right edge to split the target side-by-side
- Drop on the top or bottom edge to stack the widgets vertically
- Drop on an empty canvas and the widget fills the whole slide
Drag the thin dividers between widgets to resize the split ratio. Drag any placed widget by its body to move it into a different split; click the × in the corner to remove it. Click a widget once to select it and open its properties panel on the right.
Three-column layout
- Left column - Widget palette. Every available widget grouped by category. This column scrolls on its own when the list is long, so the canvas and properties panel always stay in view.
- Center - Slide canvas. The 16:9 preview of your slide. Click Preview in the top bar to see the slide rendered live with real data before saving.
- Right column - Widget properties. Configuration for the currently-selected widget. Every widget exposes a schema-driven properties panel, so you get only the options that apply to the widget you picked.
Naming and saving
Widget catalog
Every widget you can drop onto a custom slide, grouped by category.
🎯 Goals
- Goals & Progress - grid of live progress bars for the goals you pick. Configurable: which goals to show, display style (progress bar / traffic light / gauge).
- Single Goal Progress - focus on one goal with a selectable visualization.
📊 KPIs
- KPI Performance Cards - today's big KPI cards with pacing targets.
- Rebook Rate Bar - compact strip showing today's rebook percentage.
- MTD Summary - month-to-date revenue, appointments, and new customers.
🚦 Pulse
- Floor Pulse - traffic-light orbs for the pulses you care about (revenue / appointments / rebook rate).
📈 Trends
- Revenue Trends - revenue over time with forecast; hover any point for the day, date, and amount.
- Day-of-Week Trends - per-day-of-week sparklines.
- 7-Day Forecasted Revenue - next seven days' forecast.
- Revenue by Day of Week - 30-day average revenue broken down by day of the week (bar / pie / sparkline).
📅 Calendar
- Appointment Schedule - today's live schedule from FranPOS, with options to hide cancelled or blocked appointments.
- Next Appointment - a compact card for the next upcoming appointment. Toggle whether to show groomer, pet, and service.
- Appointment Status Mix - pie / bar chart of appointment statuses for today or yesterday.
🏅 Rankings
- Groomer Progress - new. Personal monthly progress report for the logged-in groomer: salon vs you comparison tables, add-on breakdown, and 12-month trends. On My Grooming Dashboard it is always self-scoped; on a TV custom slide it still shows only the signed-in user's numbers when they are linked as a groomer.
- Groomer Rankings (MTD) - the classic full MTD rankings slide.
- Rankings (Custom) - new. Rank groomers by any metric (revenue, appointments, rebooks, rebook %, tips, first-timers, pre-booked %, hours) over any period (today / week / MTD / YTD). Choose leaderboard, bar chart, or pie chart. Some metrics (tips, first-timers, pre-booked %, hours) are MTD-only - the picker tells you so when a non-MTD period is selected.
- Tips Leaderboard (MTD) - dedicated tips ranking.
- First-Timer Tracker (MTD) - total new clients this month or a per-groomer breakdown.
⭐ Reviews
- Google Reviews Board - team leaderboard for Google 5-star mentions. Honors your store-level bonus display and bonus amount per review settings.
- Recent Shout-outs - scrolling snippets of recent 5-star reviews.
- Review Mentions Counter - count of 5-star mentions over a configurable period, with an optional target.
📣 Notices
- Team Notices - the full notices board, with options to show only pinned or cap the count.
- Single Pinned Notice - highlight just the latest pinned notice.
⚙️ Operations
- Walk-in Queue - live walk-in queue depth with traffic-light thresholds.
- Dogs Currently in Store - big count of dogs checked in (and not yet checked out), with each dog's name and groomer. Sort by groomer, appointment time, or pet name.
- Notes Discrepancy - closed-out appointments missing notes (appointment Note or Customer NOTES tab), grouped by groomer. Click a count to see each appointment. Configure end-of-day emails in the widget properties panel (Email groomer / manager / owner, Send after time - all off by default).
- Revenue per Grooming Table - total revenue for the selected period divided by your grooming-table count, compared to your daily goal per table. See Grooming & store hours.
- Today vs Target - compact card comparing any KPI against its stored daily target.
Notes Discrepancy widget on a dashboard slide
public/help/notes-discrepancy.png
Add this PNG to the help folder, then remove pending from the guide.
🧩 Custom Metrics (generic)
These three widgets can pull any KPI from the system and display it however you want, so you're not limited to the bespoke widgets above.
- Any Metric (Single Value) - any KPI over any period (today / week / MTD / YTD), shown as a number, traffic light, gauge, or progress bar with an optional target.
- Any Metric (Over Time) - any KPI plotted as a time series (line, bar, or sparkline) for the period you pick.
- Metric Breakdown - split any metric by groomer, day of week, or service, rendered as a pie chart, bar chart, or leaderboard.
Visualizations & thresholds
Every widget can be rendered in multiple ways - pick the one that fits your TV best.
When a widget is selected in the Custom Slide Builder, the Display dropdown on the properties panel shows which visualizations it supports. Options include:
- Big Number - single giant number, optionally with a target beneath it
- Traffic Light - green / yellow / red based on configurable thresholds
- Gauge - semicircular gauge with threshold bands
- Progress Bar - a bar filling toward a target
- Bar Chart - vertical bars across a series or breakdown
- Line Chart - time-series line
- Pie Chart - proportional slices for breakdowns
- Sparkline - compact inline time-series
- Leaderboard - ranked list with values
- Default - the widget's original hand-crafted rendering (used for built-in slides on your dashboard)
Period selector
Widgets that support time-range aggregation (Rankings, Grooming Tables, Review Mentions Counter, Any Metric, etc.) also expose a Period dropdown - Today, This Week, Month-to-Date, or Year-to-Date. Historical data imported via onboarding or Data Uploads powers the longer ranges.
Traffic-light & gauge thresholds
Widgets that use a traffic light or gauge (Walk-in Queue, Pulse orbs, and any custom KPI widget with those visualizations) include a threshold editor in the properties panel. Set your green and yellow cutoffs and the direction - Higher is better (revenue, appointments) or Lower is better (walk-in queue depth). Sensible defaults are provided per metric.
MTD-only metrics
Some metrics (tips, first-timers, pre-booked %, and hours) are only reliably available for the current month, because they come from the FranPOS Metrics Report rather than per-appointment data. If you pick one of these and then switch the period to YTD or Weekly, the picker shows a small "select MTD period" hint and greys out the option - switch back to Month-to-Date to enable it again.
Grooming & store hours
One-time setup for grooming widgets, Ops Intelligence capacity, and labor estimates.
Open Admin → Store & Billing, go to the Grooming tab (owner only). Configure three areas:
Table count & revenue goal
- Number of grooming tables - how many grooming stations your store operates.
- Daily revenue goal per table - your target revenue per table per day (for example $300).
The Revenue per Grooming Table widget uses these values to compute period revenue ÷ table count and compare it to daily goal × days in the selected period.
Store hours
Set default open/close times, then configure each day of the week. Use the quick actions to apply defaults to all open days, copy Monday to weekdays, or mark weekends closed. Store hours feed Ops Intelligence → Capacity table-capacity calculations and Morning Briefing capacity snapshots.
Click Save grooming settings when finished.
Marketing hub
Local outreach and customer retention tools, reachable from the Marketing navigation or /marketing. Daily automated SMS drafts are reviewed and sent from SMS to approve.
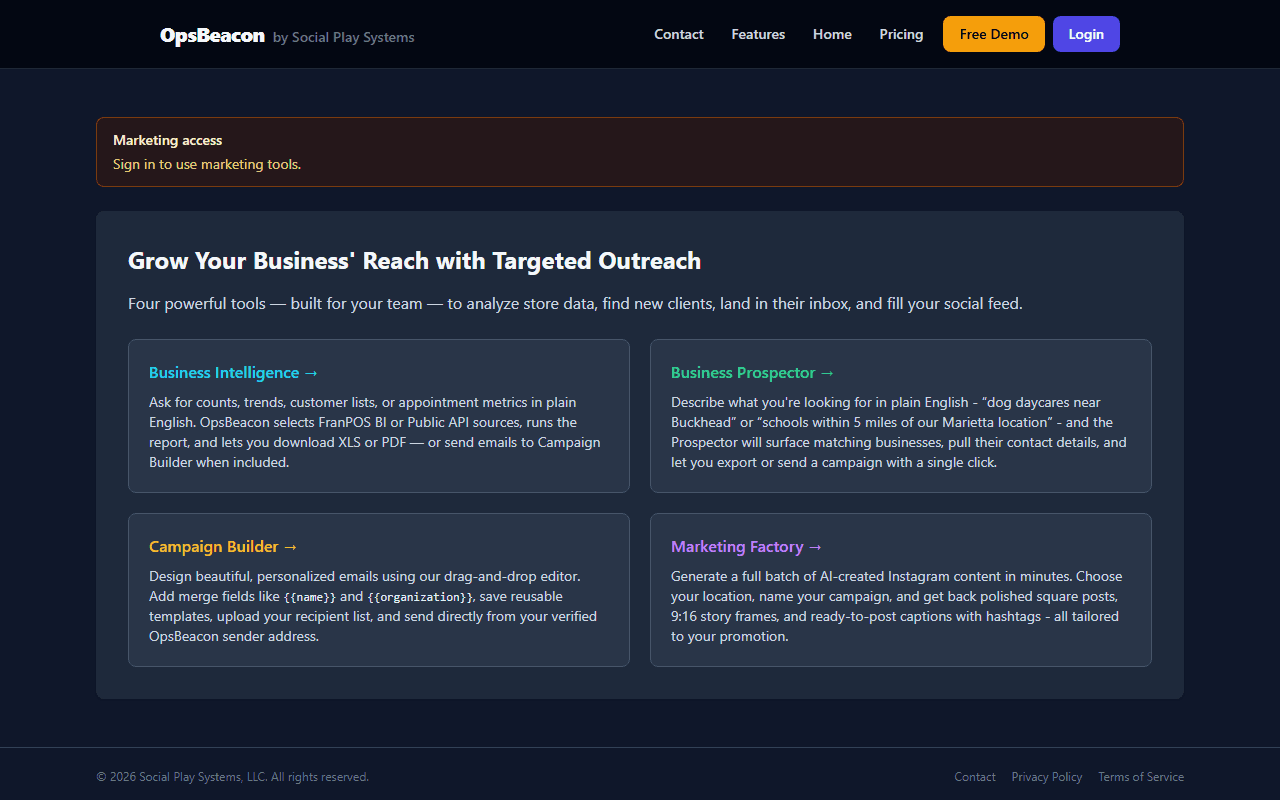
Customer CRM
Lapsed client queue, outreach history, and campaign engagement
ALFIE Business Intelligence
Ask FranPOS data questions in plain English
Business Prospector
Find nearby referral partners and prospects
Campaign Builder
Design and send email campaigns
Marketing Factory
AI-generated social posts and captions
SMS to approve
Review automated SMS drafts and Approve & send daily win-backs
Marketing tools use a separate Google sign-in from your store login. An active marketing subscription or trial is required for most generation features.
ALFIE Business Intelligence
Ask your FranPOS data questions in plain English - ALFIE picks the right report and returns results.
Open from the nav bar (ALFIE) or /marketing/bi. ALFIE can query FranPOS BI and Public API sources to answer questions like customer counts, appointment metrics, revenue trends, and customer lists.
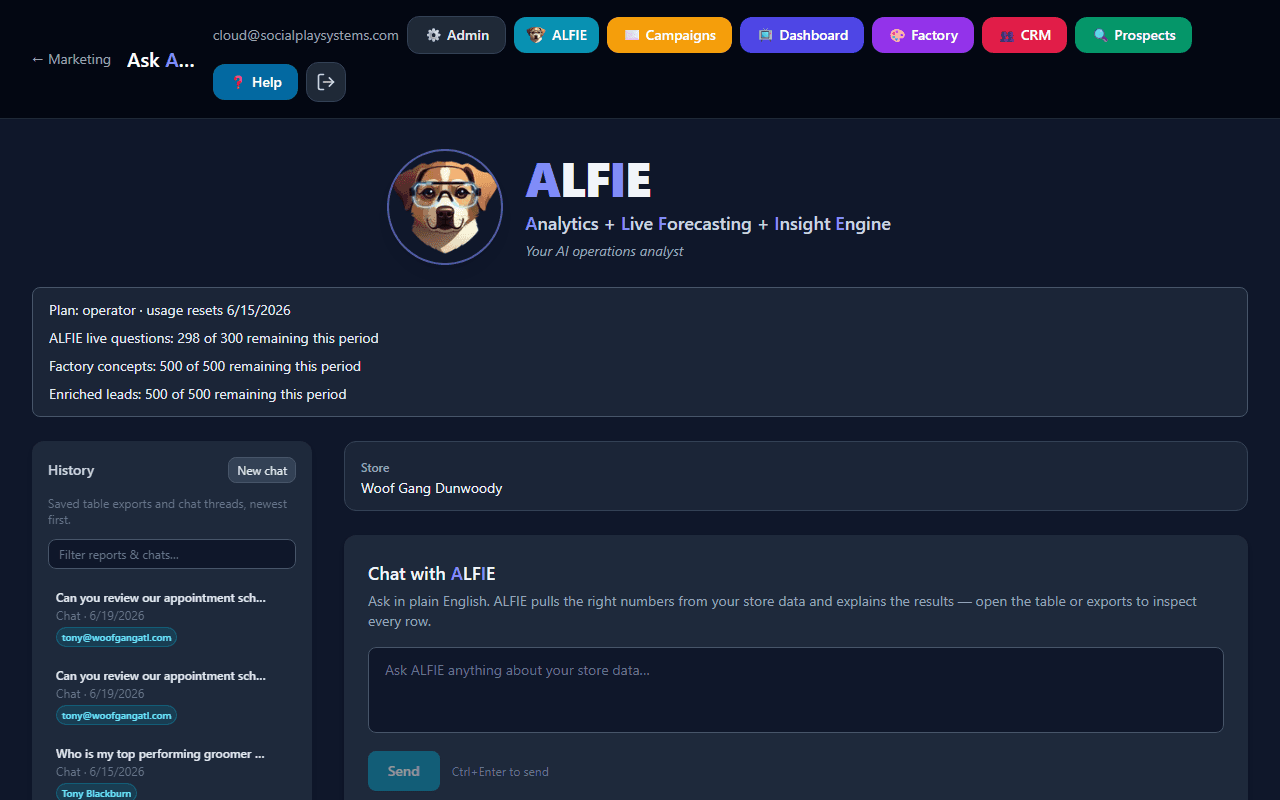
How to use it
Conversation history is saved per session so you can refine follow-up questions without re-stating context.
Marketing Factory
AI-powered image and caption generator for your social media campaigns.
The Marketing Factory creates professional Instagram-ready images and captions using AI. You provide the creative direction and the AI does the rest.
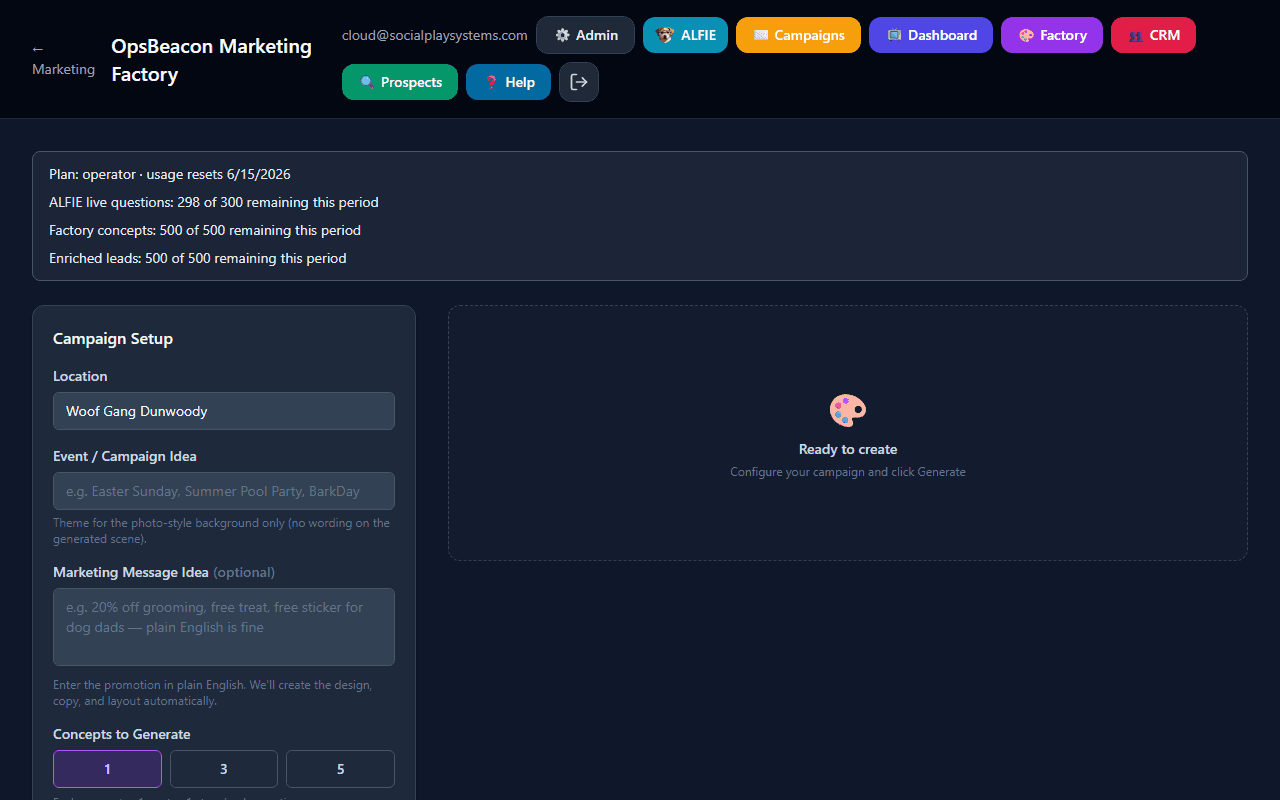
How to use it
After generating
- Hover over any image and click Download to save it
- Click Copy next to a caption to copy it to your clipboard
- Use the Share buttons to get a shareable link
- All batches are saved to Your Library so you can come back to them later
An active subscription or trial is required to generate content.
Publish to Facebook, Instagram, and TikTok (SOCi)
After you connect SOCi under Admin → Store Settings → Integrations, Marketing Factory can publish generated creatives to your linked social channels.
Marketing Factory SOCi publish dialog
public/help/marketing-factory-soci.png
Add this PNG to the help folder, then remove pending from the guide.
Yelp
Customer CRM
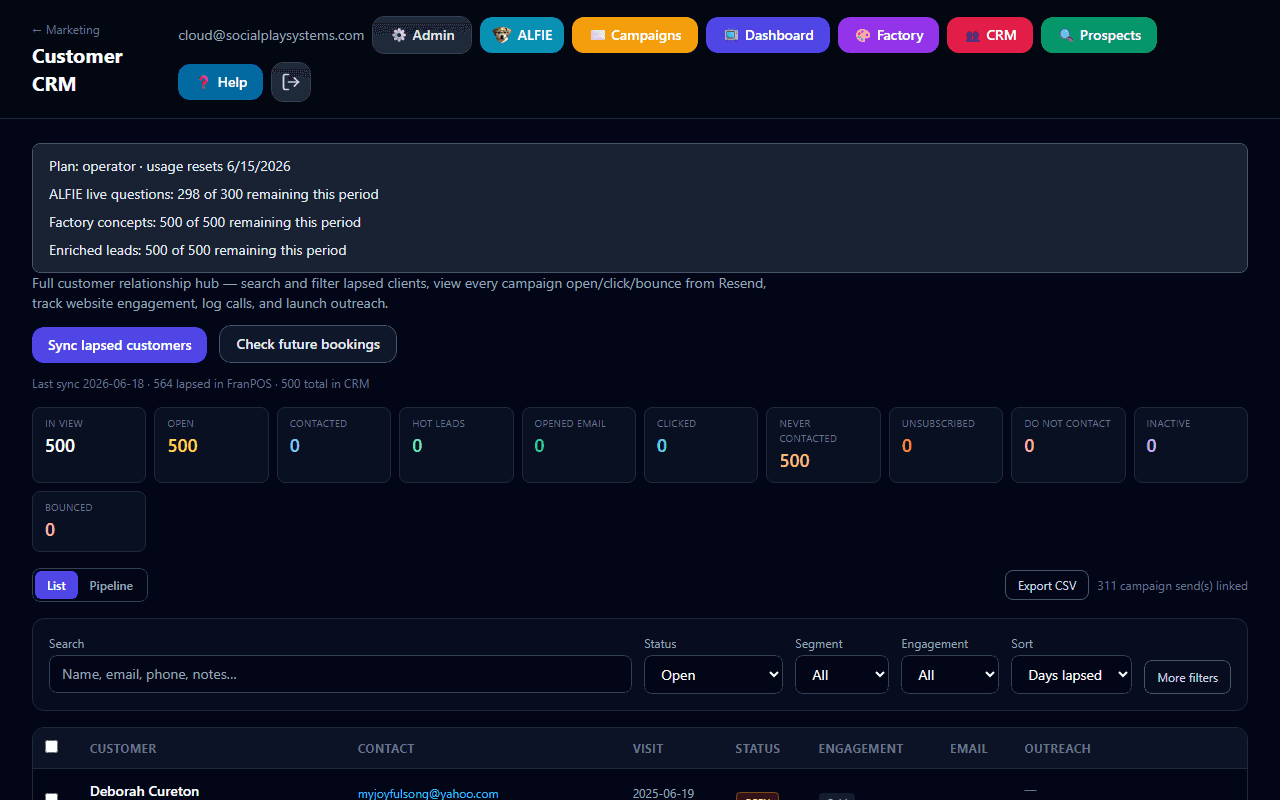
A full customer relationship hub for lapsed and at-risk grooming clients - search, filter, track outreach, and see every Campaign Builder email open and click.
Open from the nav bar (CRM) or /marketing/crm. CRM connects Ops Intelligence follow-up alerts, FranPOS customer data, and Campaign Builder tracking into one place.
Ops Intelligence shortcut
Getting customers into CRM
Search and drill-down filters
Use the search box to find customers by name, email, phone, notes, or campaign subject. Additional filters help you build targeted outreach lists:
- Status - Open, Contacted, Responded, Resolved, or Dismissed
- Segment - Active, lapsed, at-risk, or inactive (based on days since last visit)
- Lapsed only - quick filter for 60+ days since last grooming (lapsed + inactive segments)
- Engagement - Hot, Warm, Light, Scanner, Problem, or Cold (same classification as Campaign Builder tracking)
- Opened / Clicked / Bounced - filter by email behavior (expand More filters)
- Days lapsed range - min/max days since last grooming visit
- Never contacted - customers with no logged outreach yet
- Has email only - hide rows without an email address
- Sort - by days lapsed, name, last contact, opens, clicks, or last visit
The KPI bar at the top updates with your current filters (open count, hot leads, opened, clicked, never contacted, bounced).
List view vs. Pipeline view vs. Call Queue
- List - full table with contact info, Next Appt, engagement badges, email stats, and quick actions (Email, Call). Use column controls (Leads-style) to show or hide fields.
- Pipeline - kanban columns (Open → Contacted → Responded → Resolved) to drag customers through your outreach workflow
- Call Queue - phone-first list for staff follow-up. Click Call, then log the outcome in the call-result modal (Left Message, Moved, Scheduled Appointment, Phone Disconnected, or Other) with optional follow-up scheduling or do-not-call.
Customer CRM Call Queue tab
public/help/crm-call-queue.png
Add this PNG to the help folder, then remove pending from the guide.
CRM call result modal
public/help/crm-call-result.png
Add this PNG to the help folder, then remove pending from the guide.
Clickable KPI cards
The KPI bar at the top updates with your current filters. Click a card (for example Call Queue calls, or booked after call) to apply that filter to the contact list immediately.
Customer detail drawer
Click any customer row to open the detail panel with four tabs:
- Overview - visit history, segment, status, and a rolled-up engagement summary
- Campaigns - every Campaign Builder email to this customer, including:
- Send, delivered, opened, clicked, bounced, complained, and unsubscribed status
- Open and click counts with timestamps
- Individual click URLs (which links they clicked)
- Website engagement - page views, video watch progress, demo form submissions
- Hot/Warm/Light engagement classification per send
- Activity - unified timeline merging phone logs, email sends, opens, clicks, bounces, and demo submissions
- Notes - free-form notes saved to the customer record (conversation summary, preferences, follow-up plan)
Outreach actions
How campaign tracking connects
When you email customers from CRM, each recipient is tagged so Campaign Builder and Resend webhooks can update their record automatically. You will see opens, clicks, and bounces on the customer without leaving CRM. Historical sends also appear when the recipient email matches, even if the email was sent before CRM existed.
Engagement classes match Campaign Builder tracking: Hot (demo intent or strong video engagement), Warm (video started or deep watch), Light (website visit), Scanner (email click with no human website activity), Problem (bounce/complaint), and Cold (no meaningful engagement yet).
When customers leave the queue
Campaign Builder
Build and send email campaigns to your customers.
The Campaign Builder lets you design professional emails, upload a list of recipients, and send your campaign - all from one place.
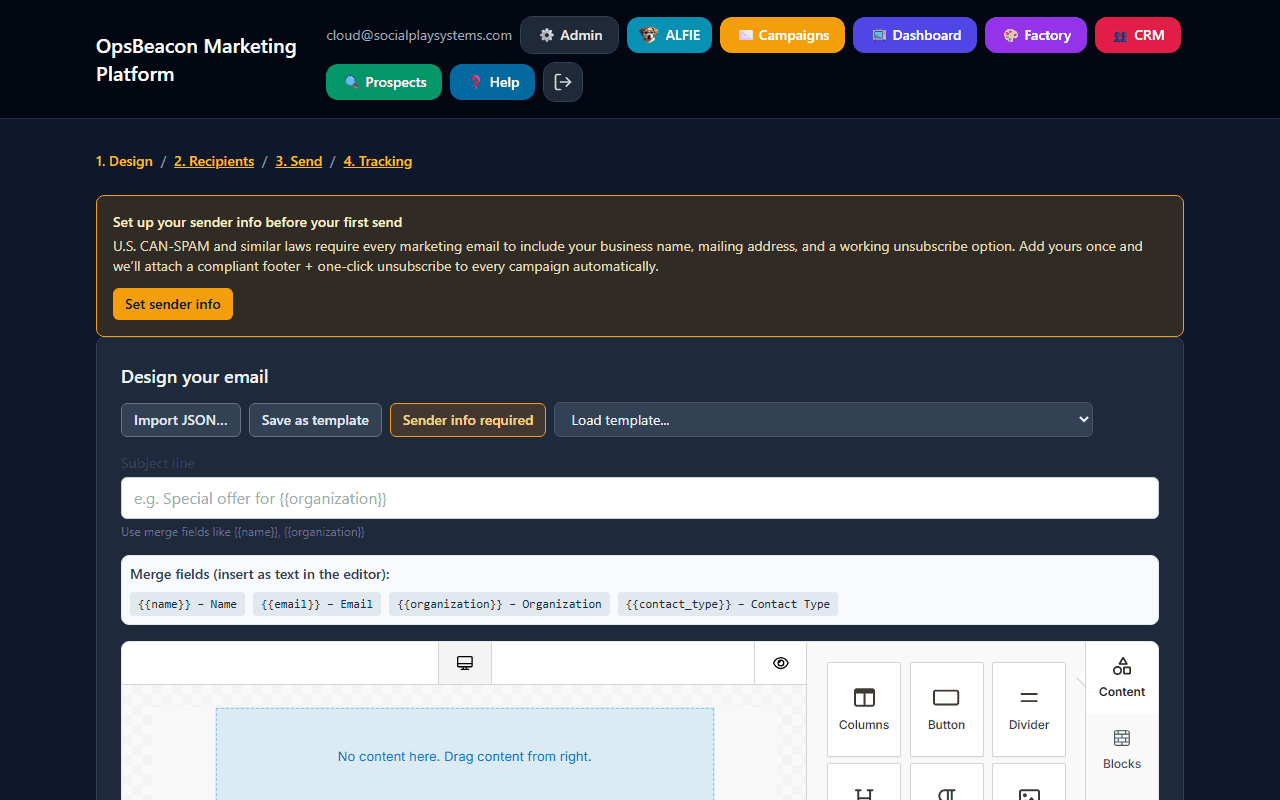
Four-step process
{{name}} to personalize each recipient's email.Campaign Builder schedule for later
public/help/campaign-schedule-send.png
Add this PNG to the help folder, then remove pending from the guide.
Business Prospector
Find potential business partners and customers near your store.
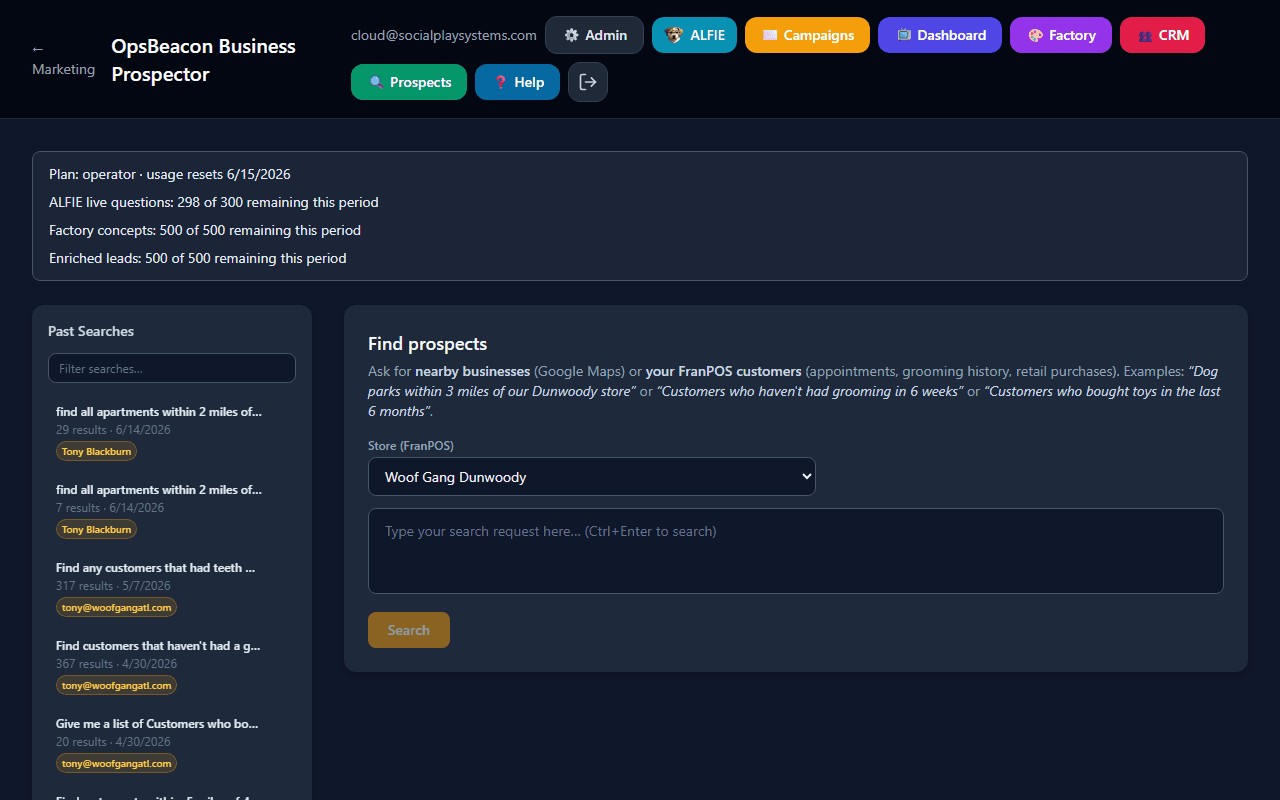
The Business Prospector helps you discover nearby businesses that could be great referral partners or customers - like dog daycares, veterinary clinics, pet-friendly apartments, and more.
How to use it
Past searches are saved so you can reload and filter results anytime. Trial accounts can view a limited number of enriched results per search.
Team access
Invite your team and control who has access.
Store owners can invite team members from Admin → Team Access. Here's how it works:
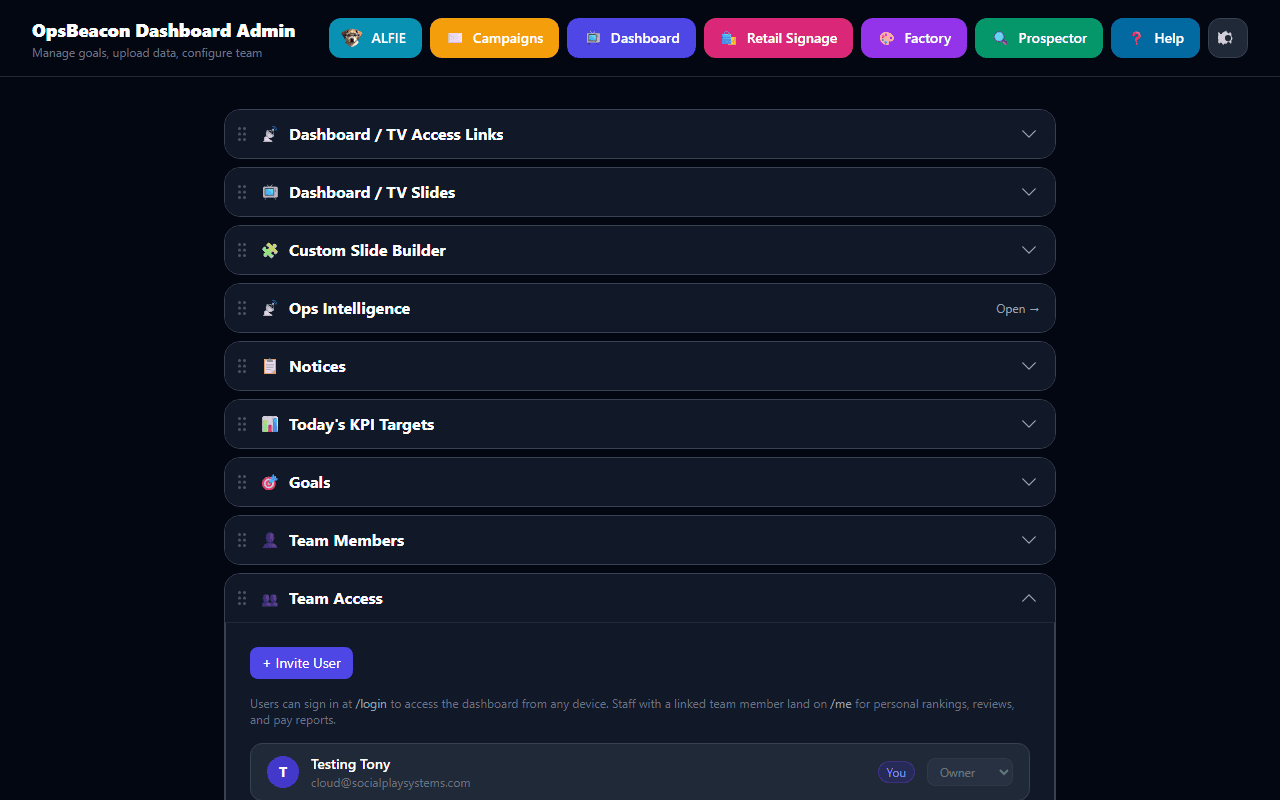
- Enter a team member's email address and choose a role: Staff, Manager, or Owner
- They'll receive login credentials and can sign in at /login
- If someone forgets their password, they can use Forgot password? on the sign-in page - no owner action required
- Staff use My Home, My Grooming Dashboard (linked groomers), or the store TV slideshow; they personalize TV slides via the gear menu when applicable
- Managers get Admin access (except billing changes), Ops Intelligence, marketing tools, and the Executive Dashboard
- Owners have full access including billing, FranPOS credentials, and team management
Linking logins for My Grooming Dashboard
For a groomer to see My Dashboard on My Home and open My Grooming Dashboard, their OpsBeacon login must be linked to the correct payroll team member with role Groomer. Configure team member roles under Admin → Ops Intelligence → Team members, then link the user under Admin → Team Access.
Billing & subscription
Manage your subscription and payment details.
New stores start with a free trial (typically 14 days). During the trial you have full access to the TV Dashboard and all features.
After your trial ends:
- The TV Dashboard will show a prompt to subscribe
- You can still access Admin to set up your subscription
Managing your subscription
In Admin → Store & Billing, use Manage subscription and billing to open /admin/subscription. There you see products and pricing from Stripe, complete checkout for a new subscription, or (once subscribed) open the Stripe Customer Portal to change plans, payment method, and cancellation. Your administrator must enable the same prices in Stripe under Settings → Billing → Customer portal.
Plan tiers (overview)
- Owner Briefing (Starter) - daily Owner Briefing email entry plan (setup fee waived during introductory rollout)
- Dashboard - Owner Briefing plus live TV / Executive dashboards and team display
- Growth / Operator - adds deeper Ops Intelligence tools (Pay Sheets, P&L, and related advanced tabs depend on plan)
- Franchise - multi-location / group features for franchise operators
Owner Briefing plan on the pricing page
public/help/billing-briefing-starter.png
Add this PNG to the help folder, then remove pending from the guide.
Only the store owner can manage billing.
Troubleshooting
I didn't receive my verification email
Check your spam folder. If it's not there, try signing in at /login - you'll see an option to resend the verification email.
I am stuck on MFA or Terms after login
Complete /account/setup-mfa and /account/accept-terms, then return to Admin or Dashboard. Manage MFA later from /account/security.
The Appointments Accept badge will not clear
The badge counts FranPOS online bookings still in Requires Approval for today and future dates. Approve or decline them in FranPOS, then wait for the next appointments sync (or run Sync from FranPOS). OpsBeacon does not approve bookings for you.
SOCi publish fails or shows no content ID
Confirm SOCi is connected under Store Settings → Integrations, then retry Publish via SOCi. A successful publish must return a real SOCi content id - if you see an error, check channel permissions in SOCi.
Inventory product photos are missing
Admin → Inventory shows a FranPOS thumbnail next to each product. Click the thumbnail or name to open a large viewer with zoom and the item's stock, pricing, sales, and expiration details. If the photo is blank, that SKU has no image in FranPOS.
Staff Time Clock banner is missing
Confirm the store is on Growth or higher, Staff Time Clock is enabled under Admin → Staff Time Clock, and your login is linked to a team member in Team Access. The banner does not appear on the shared-tablet Order Request kiosk (PIN lock screen).
Schedule email skipped someone who looks like they have an email
The Team Members grid can show a linked login even when the payroll profile email is empty. Employee Scheduling now uses that login as a fallback and names anyone still skipped. Invite also writes the invite address onto the team member profile.
Employee Scheduling Save did not update FranPOS
Confirm the team member has a FranPOS employee ID, click Save to FranPOS again, and wait for BI lag after clears. Duplicate to Next Week posts immediately; Copy To only drafts until you save. If time-off approval is blocked, clear bookings on those days first.
Order Request is missing or PIN login fails
Owners must enable Order Request under Admin → Order Request and add catalog items. Kiosk links need the correct store query param. Staff PINs come from FranPOS - reset there if login fails.
I forgot my password
Go to /login and click Forgot password?. Enter your account email and check your inbox for a reset link (expires in about one hour). After setting a new password, sign in again. If you still can't get in, confirm you're using the same email your store owner invited, or ask them to verify your account in Admin → Team Access.
My password reset link expired or doesn't work
Reset links expire after about one hour and can only be used once. Request a fresh link from /forgot-password. If the email never arrives, check spam and confirm you entered the same email address your store owner invited you with.
My TV Dashboard says "Billing blocked"
Your trial has ended or your subscription payment failed. Go to Admin → Store & Billing and open Manage subscription and billing.
The dashboard isn't showing any data
Make sure your FranPOS connection is set up correctly in Admin → Store & Billing → Update FranPOS connection. Then click Sync from FranPOS to pull your latest data.
Marketing Factory says "Subscription required"
You need an active marketing subscription or trial to generate content. Contact your administrator to get access.
I can't invite team members
Only the store owner can invite new team members. If you're staff, ask your store owner to add people from Admin → Team Access.
My custom slide isn't showing on the TV
Open Admin → Dashboard / TV Slides and confirm the toggle next to your custom slide is on. If it's on but you still don't see it, open the TV Dashboard and click the gear icon - staff-level slide preferences override the master list for that device's signed-in user.
A metric is greyed out in the widget properties panel
That metric is MTD-only (tips, first-timers, pre-booked %, or hours) and you have the widget set to a non-MTD period. Change the Period back to Month to Date and the option will become selectable.
Revenue per Grooming Table says "not configured"
The widget needs the store-wide table count and daily goal. Open Admin → Store & Billing → Grooming (owner only) and set both values - see Grooming & store hours.
Ops Intelligence Capacity says "not available yet"
Configure grooming tables and store hours under Admin → Store & Billing → Grooming, assign team member roles on Ops Intelligence → Pay Sheets, and run Sync from FranPOS so scheduled hours and appointments are current.
I don't see My Dashboard on My Home
That button appears only for logins linked to a team member with the Groomer role. Ask your owner or manager to link you in Admin → Team Access and set your role under Ops Intelligence Team members. See My Grooming Dashboard.
My Grooming Dashboard is empty or says nothing is approved
An owner or manager must enable Groomer Mobile Dashboard and check at least one approved widget under Admin → Dashboard / TV Slides.
Groomer Progress shows $0 commission but has revenue and tips
Commission comes from FranPOS when available; otherwise OpsBeacon estimates from MTD booked revenue and the groomer's commission rate in Team members. Confirm FranPOS is connected and the groomer's commission rate is set under Ops Intelligence → Team members.
Pay Sheets show missing groomers or $0 revenue
Check that team member names match FranPOS (use Refresh from FranPOS), confirm the pay period dates cover days with closed-out appointments, and click Regenerate draft after updating rates. Read any Data notes banner on the pay sheet for aggregation warnings.
Pay Sheets show no tax columns or wrong state taxes
Set your store state under Admin → Store & Billing, then click Regenerate draft on the pay period. Tax estimates are computed when the draft is generated - older periods saved before this feature need a regenerate. Groomer tips are intentionally excluded from taxable wages; bather and retail tips are included.
P&L payroll looks too low or uses capacity estimates
Generate and finalize Pay Sheets for dates that overlap your P&L period. If your store uses ADP, QuickBooks, or Gusto, submit and sync tax actuals on those periods. P&L prefers pay sheet employer labor cost (gross + employer taxes) over Capacity scheduled-hour estimates. Configure fixed expenses on the P&L tab if utilities or rent show as zero.
Submit or Sync payroll buttons are missing
Store owners must select the correct Payroll provider on Pay Sheets. Integration buttons appear only for ADP, QuickBooks, or Gusto after a period is finalized. See Payroll provider integrations.
Morning Briefing did not arrive
Confirm Ops Intelligence is enabled, Morning Briefing delivery is on, recipient emails are saved, and the delivery time/timezone are correct. Use Send test email now to verify delivery, then check spam folders.
I cannot open Ops Intelligence
Only owners and managers have access. Staff should use My Home or My Grooming Dashboard (linked groomers), not Admin or the full store TV dashboard. Ask your store owner to upgrade your role in Admin → Team Access.
CRM sync is slow or shows no customers after syncing
Sync pulls from FranPOS BI and may take 1-3 minutes for stores with many lapsed clients. Wait for the green success message. Confirm FranPOS credentials under Admin → Store & Billing. If the list is empty, try setting Status to All - resolved customers are hidden when filtering to Open only.
Campaign opens and clicks are not showing in CRM
Engagement appears when emails were sent through Campaign Builder to the same email address, or when the send was launched from CRM (which links the contact automatically). Open the customer's detail drawer → Campaigns tab. Allow a few minutes after sends for Resend webhooks to update open/click counts.
Ops Intelligence says contact lapsed customers but CRM is empty
Ops Intelligence summarizes counts from appointment history; CRM needs a one-time Sync customers from FranPOS to import the full client list with email and phone. Click Open CRM on the Customer Follow-Up workflow section, then sync.
YTD or weekly ranges on a widget show empty
Longer time ranges rely on historical data being present in Firestore. Use Admin → Data Uploads to import the FranPOS Sales and Appointment reports for the missing dates, or run Sync from FranPOS if your live API credentials are configured. Onboarding handles YTD for new tenants automatically.
Still stuck?
Open a tracked support ticket with clear response timelines, or jump into your Support Portal to follow up on an existing request.
Prefer email? support@opsbeacon.app - we open a ticket and reply with your portal link.